Product demo.
  What is data observability?
  What is a data mesh--and how not to mesh it up
  The ULTIMATE Guide To Data Lineage
 Data Quality Monitoring – You’re Doing It Wrong


Lior Gavish
CTO and Co-founder, Monte Carlo. Programming wizard and lover of cats.

Bryce Heltzel
Bryce is a product manager at Monte Carlo. Previously, he served as an engineer at Looker and Google.

Ryan Kearns
Ryan is a data scientist at Monte Carlo.
Data quality monitoring is the process of automatically monitoring the health of data pipelines and the data that runs through them using machine learning. Occasionally, we’ll talk with data teams interested in applying data quality monitoring narrowly across only a specific set of key tables.
The argument goes something like: “You may have hundreds or thousands of tables in your environment, but most of your business value derives from only a few that really matter. That’s where you really want to focus your efforts.”
In today’s world, this approach is no longer sufficient. It’s true – you need to go “deep” on certain data sets, but without also going broad, you’re missing the boat entirely.
As data environments grow increasingly complex and interconnected, the need to cover more bases, faster, becomes critical to achieving true data reliability. To do this, you need data monitors that drill “deep” into the data using both machine learning and user-defined rules, as well as metadata monitors to scale “broadly” across every production table in your environment and to be fully integrated across your stack.
In this post we’ll explain why – and how – delivering reliable data requires layering multiple types of data monitors across the field, table, enterprise data warehouse, and stack levels.
Deep data quality monitoring at the field level
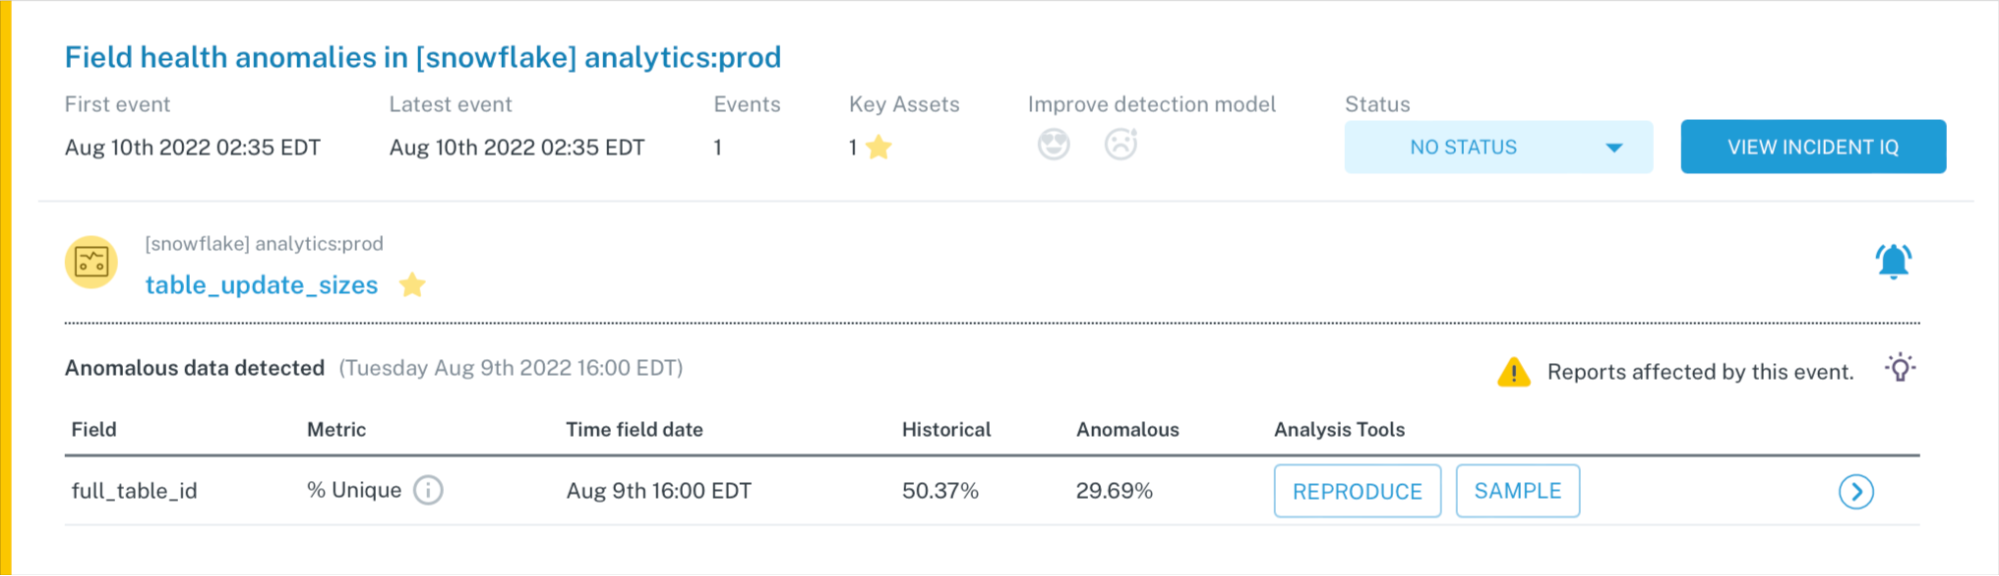
The first type of “deep” data monitors you need use machine learning to generate pre-configured data quality rules to validate the data in your tables. These are best deployed when you know a set of fields in a particular table is important, but you aren’t sure how it will break. Such data monitors are effective at detecting anomalies that occur when individual values in a field are null, duplicated, malformatted or otherwise broken. It can also identify cases when metrics deviate from their normal patterns.
You don’t need to pre-configure rules and thresholds for these types of monitors – most data quality monitoring solutions will offer suggestions based on historical trends in the data. However, because you’re querying the data, it is compute intensive. This makes it prohibitively expensive to scale throughout full pipelines, making them best suited for “going deep” on your high risk tables.
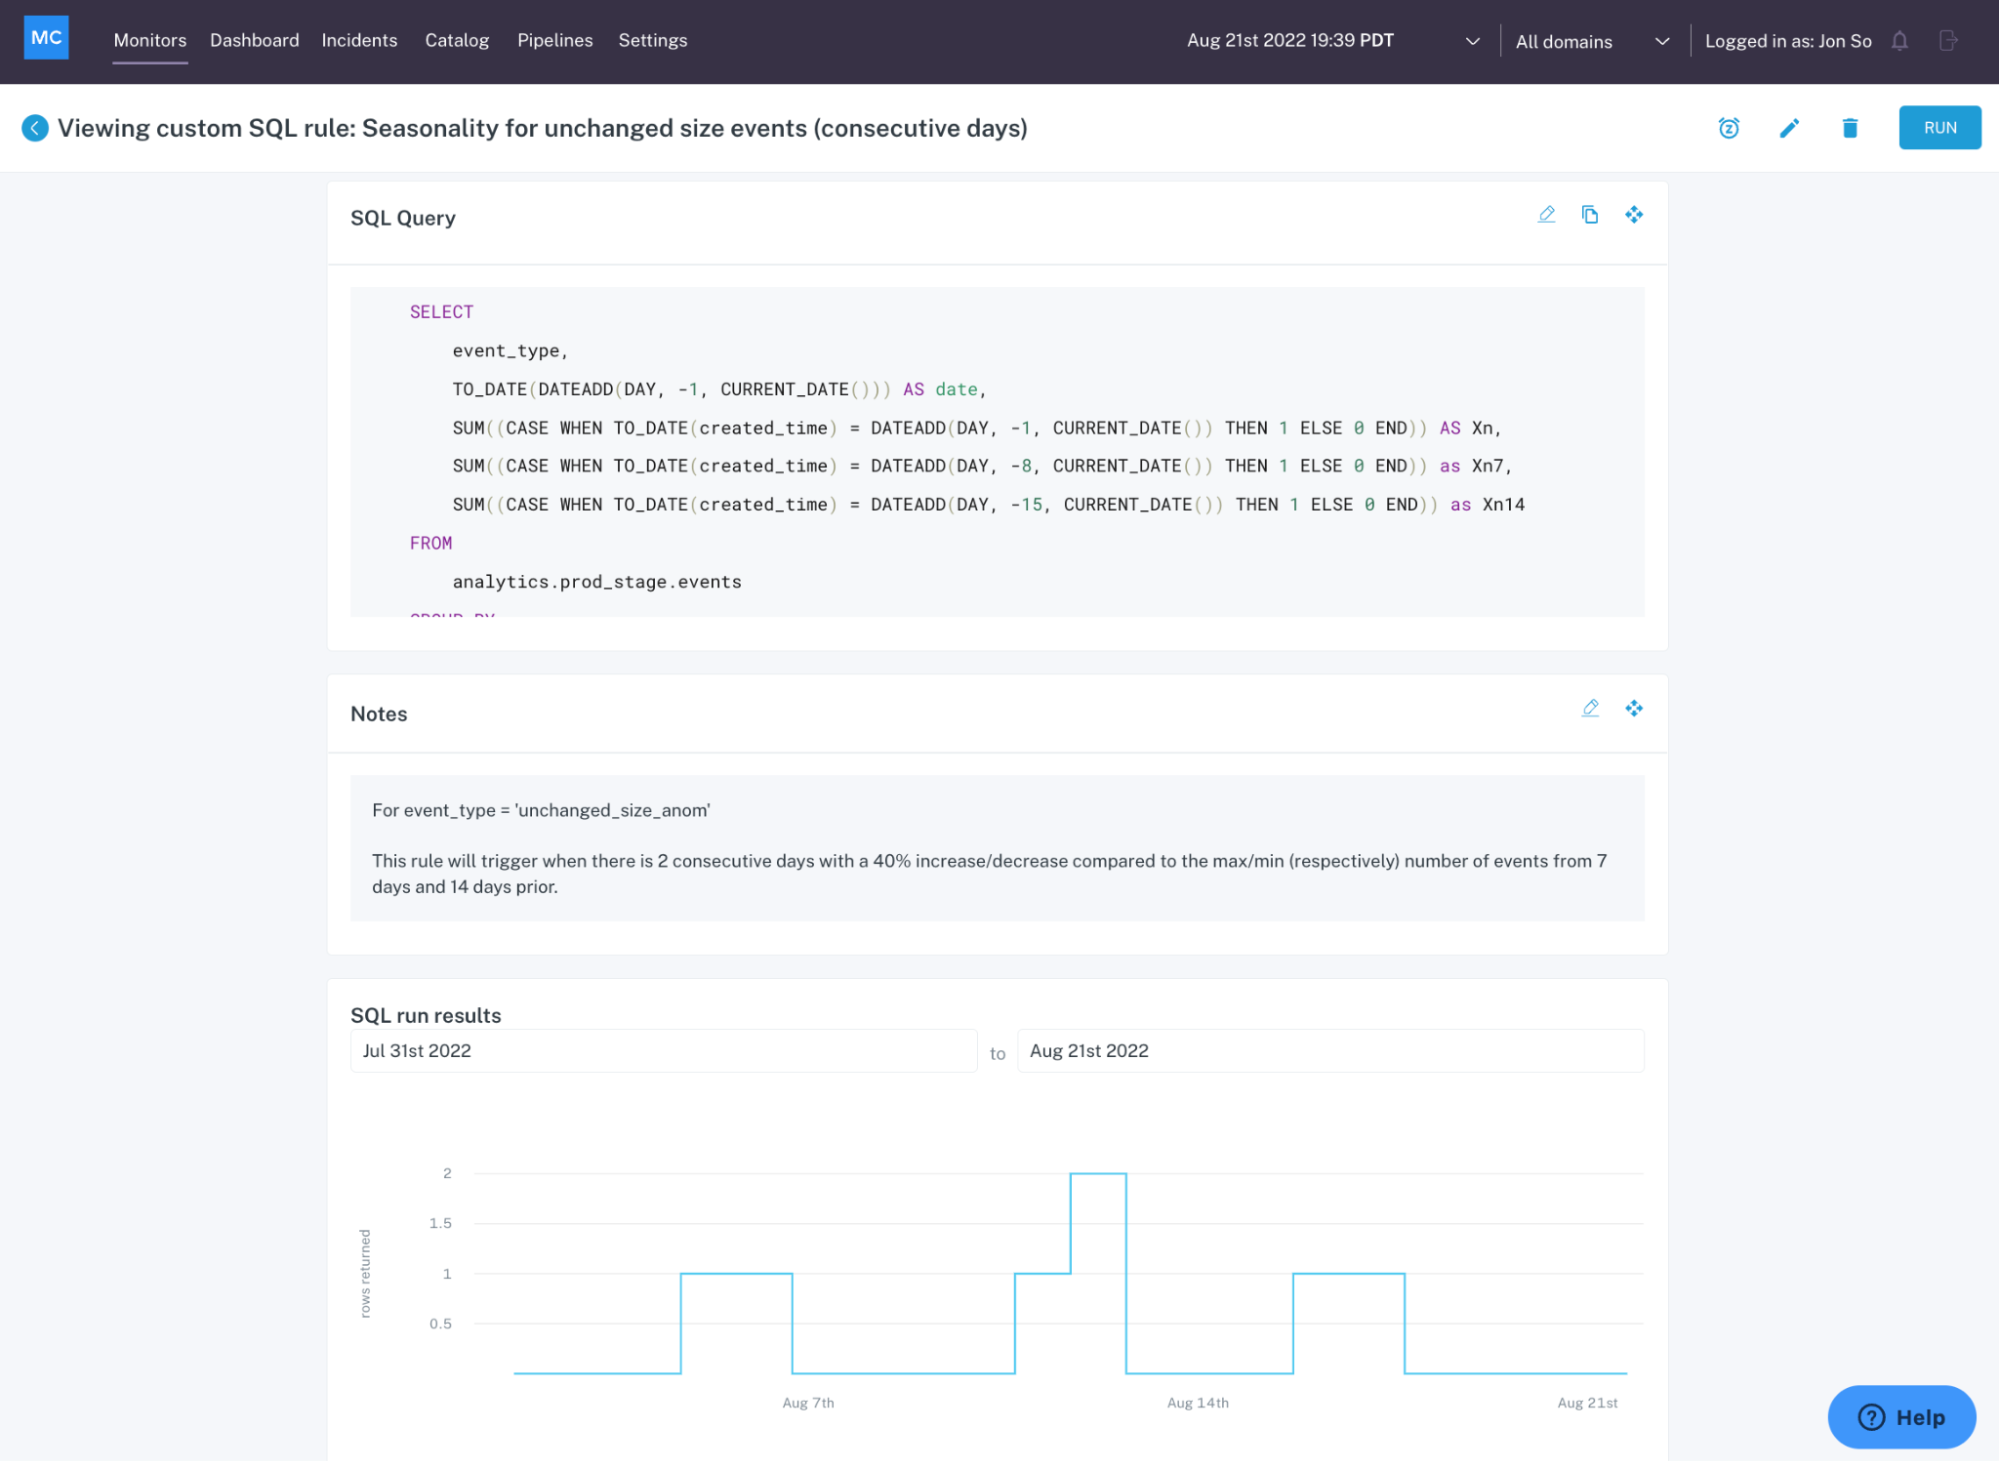
The second type of monitors, user-defined monitors trigger an alert when the data fails specified logic. User-defined, machine learning-powered data quality monitors are best deployed using the most well-defined, understood logic to catch anomalies that are frequent or severe. It is typically expressed through a SQL statement.
In other words, these data monitors track data accuracy, data completeness, and general adherence to your business rules. For example, you may have a metric like shipment time that can never be negative or null, or a field in a critical table that can never exceed 100 percent. It can even help track whether data stored in one table matches data stored in another table, or whether your metrics are consistent across multiple breakdowns and calculations.
Deep data quality monitoring at the table level
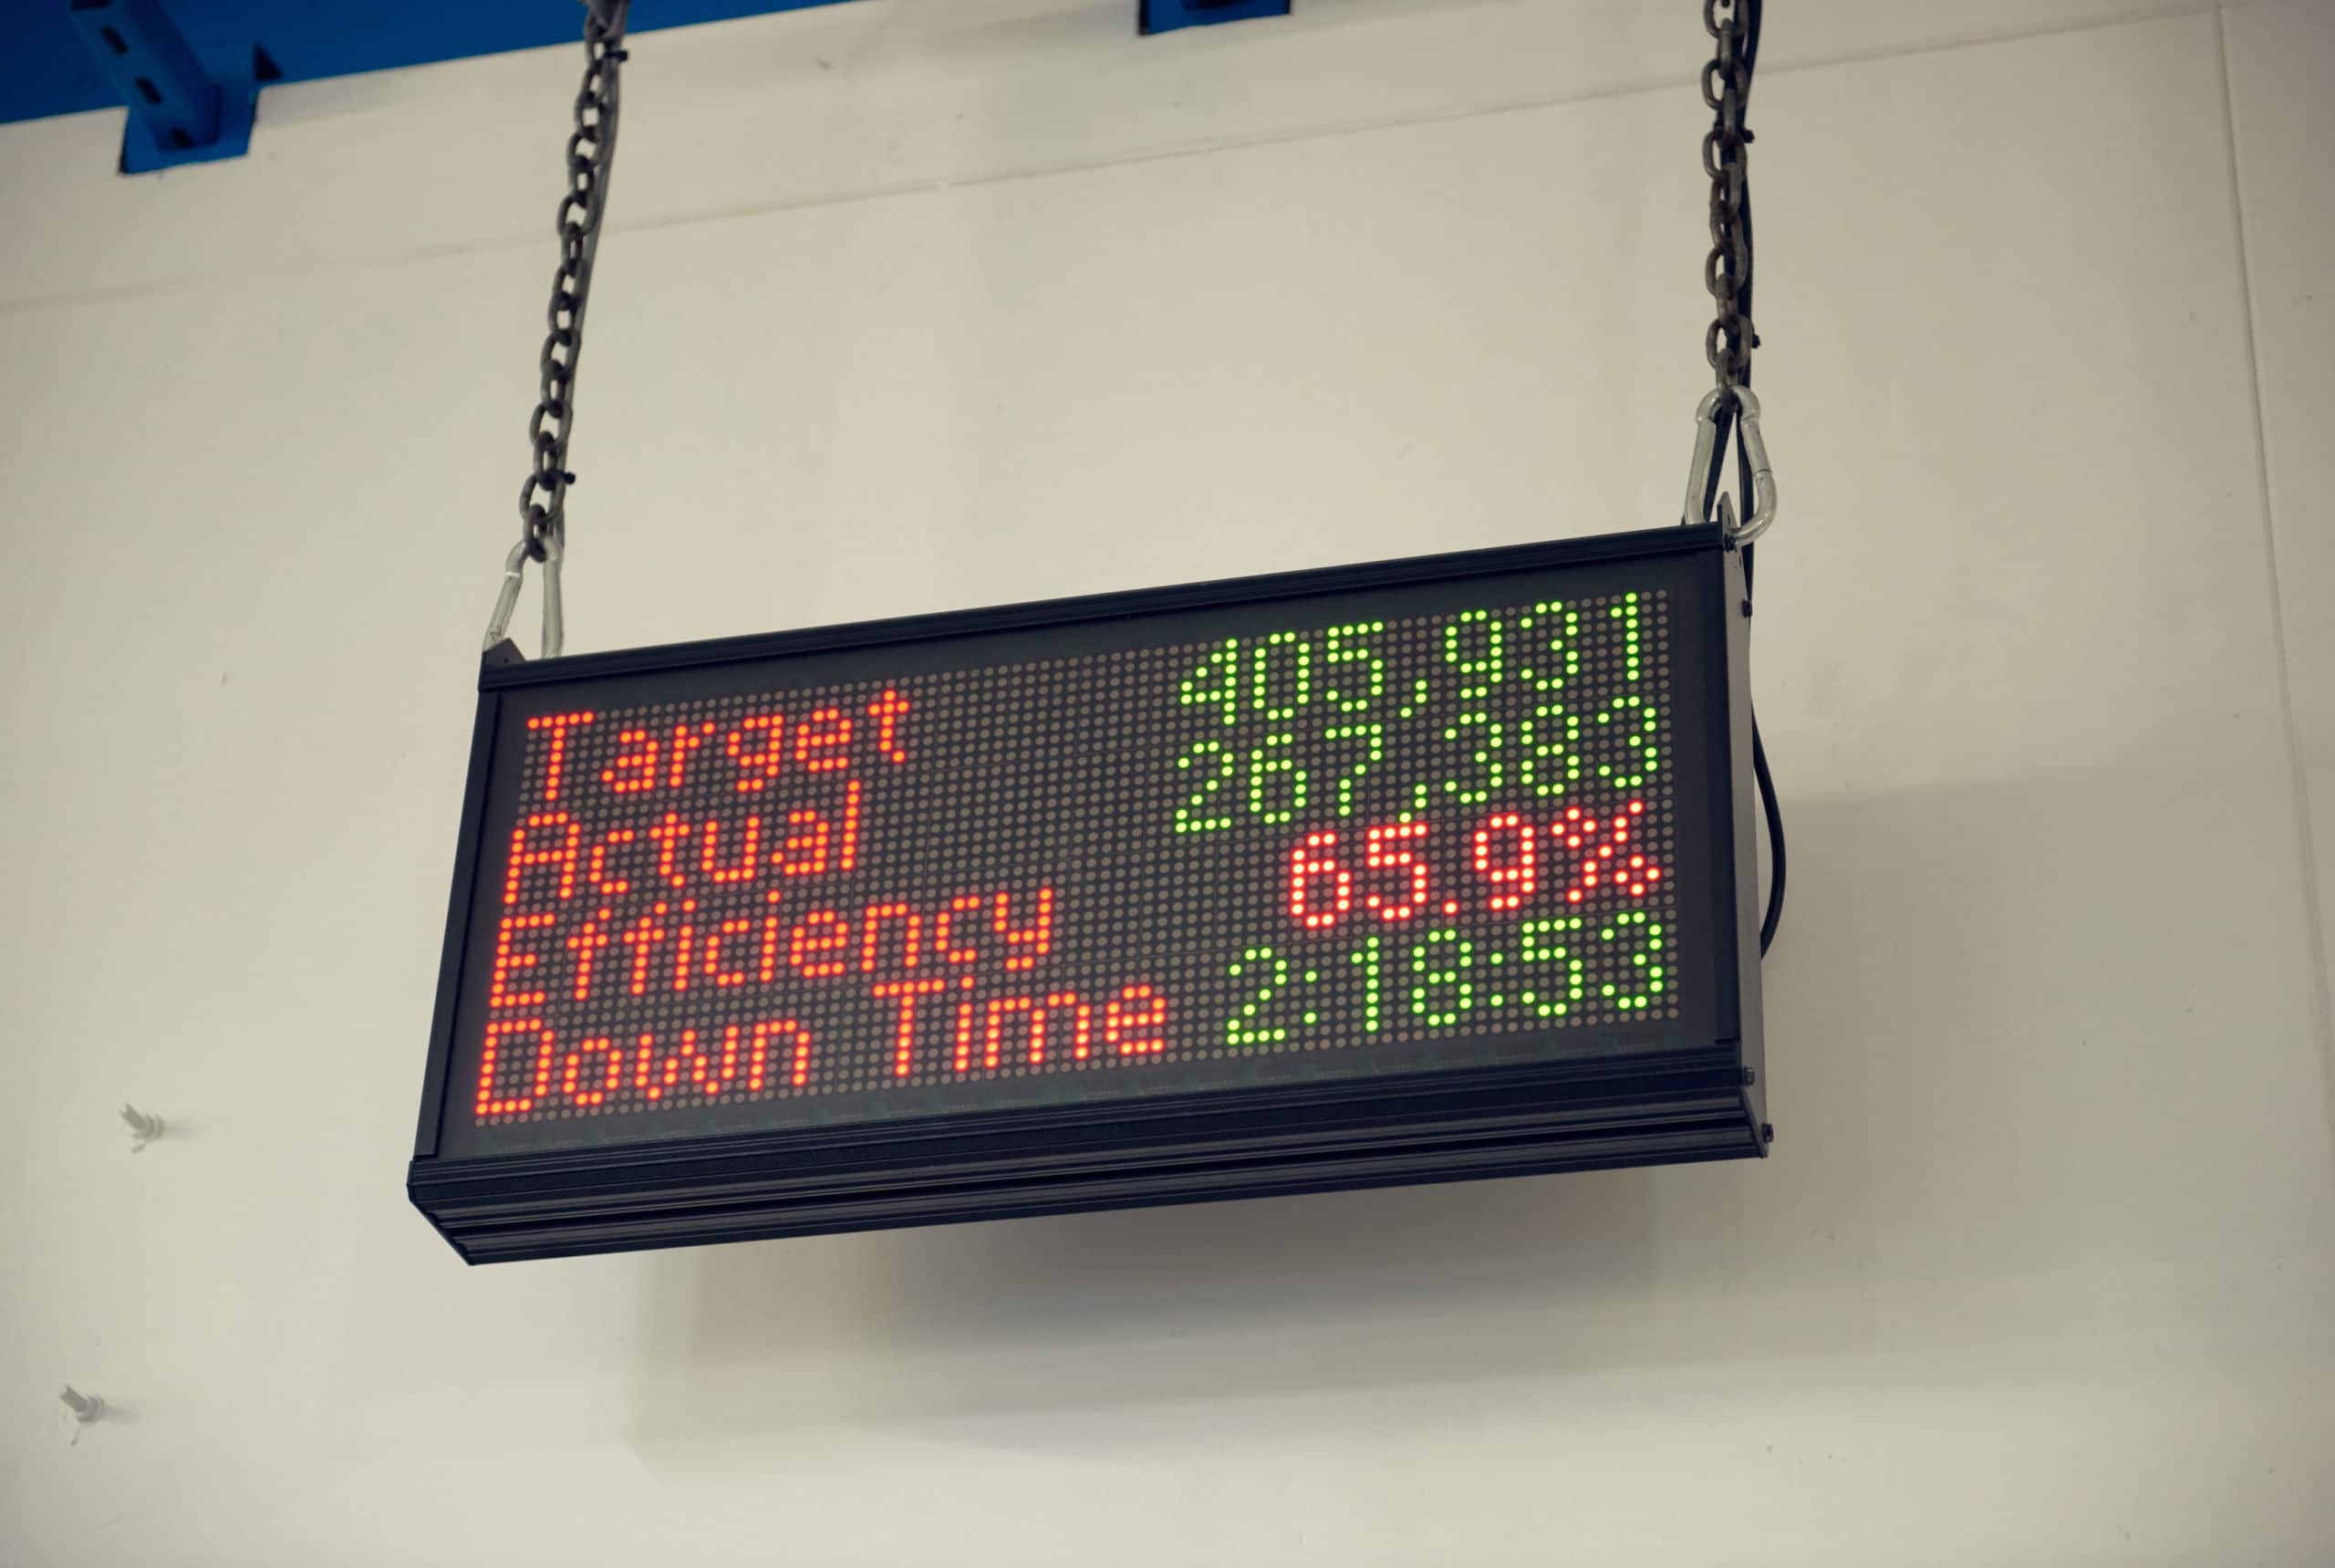
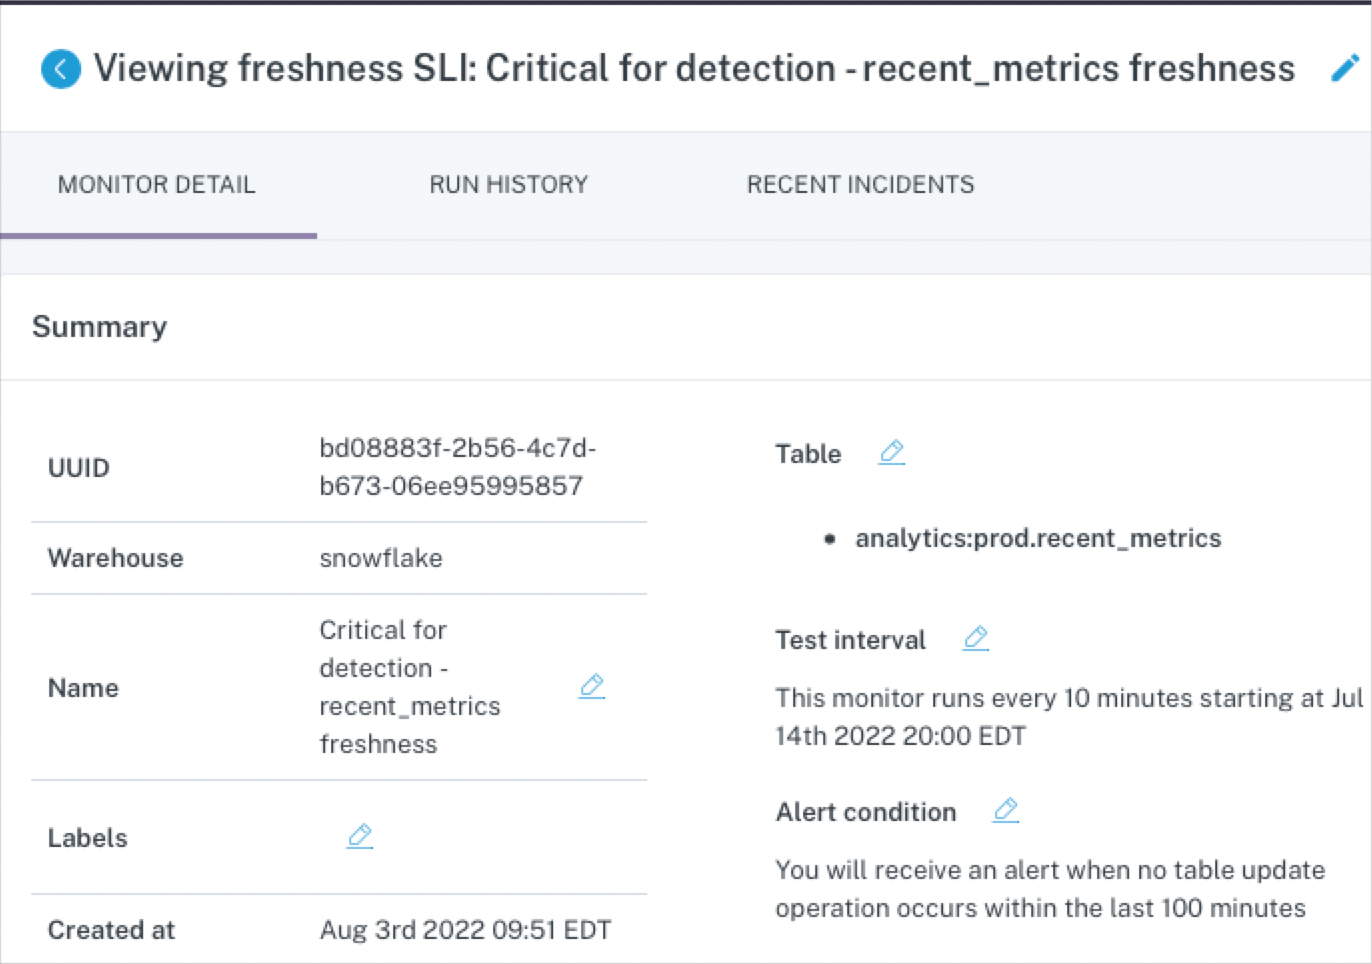
At the table level, ML-based data monitors can detect anomalies like freshness (did that table update when it should have?) and volume (are there too many or too few rows?).
But again, this approach is too costly to deploy at scale across all of your pipelines, making these data quality monitors best reserved for a few critical assets. For example, if your CEO looks at a specific dashboard every morning at 8:00 am EST and heads will roll if the data feeding that report hasn’t been updated by then.
The limitations of narrow and deep data quality monitoring
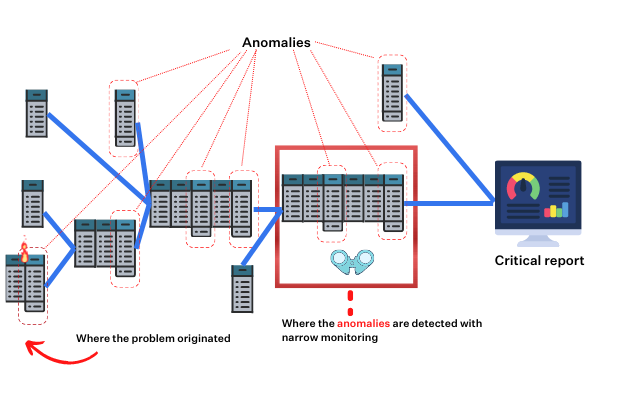
When you only deploy user-defined and machine learning monitors on your most important tables:
- You miss or are delayed in detecting and resolving anomalies more evident upstream.
- Alerting on a key table, oftentimes dozens of processing steps removed from the root cause, will involve the wrong person and give them little context on the source of the issue or how to solve it.
- Without understanding the dependencies in the system, your team will waste time trying to determine where to focus their monitoring attention. Maintaining that as the environment and data consumption patterns change can also be tedious and error prone.
Broad metadata monitoring across the enterprise data warehouse
“Broad” metadata monitors can cost-effectively scale across every table in your environment and are very effective at detecting freshness and volume anomalies as well as anomalies resulting from schema changes (did the way the data is organized change?).
By casting a wider net, you’re not only catching all impactful anomalies, you are also reducing time to their detection and resolution by catching them closer to the source of an incident. It’s time and resource expensive to trace anomalies back several layers and people upstream, conduct the necessary backfills, and otherwise resolve the incident.
Well-trained models, dynamic alert grouping, and granular alert routing ensure alert fatigue doesn’t become an issue.
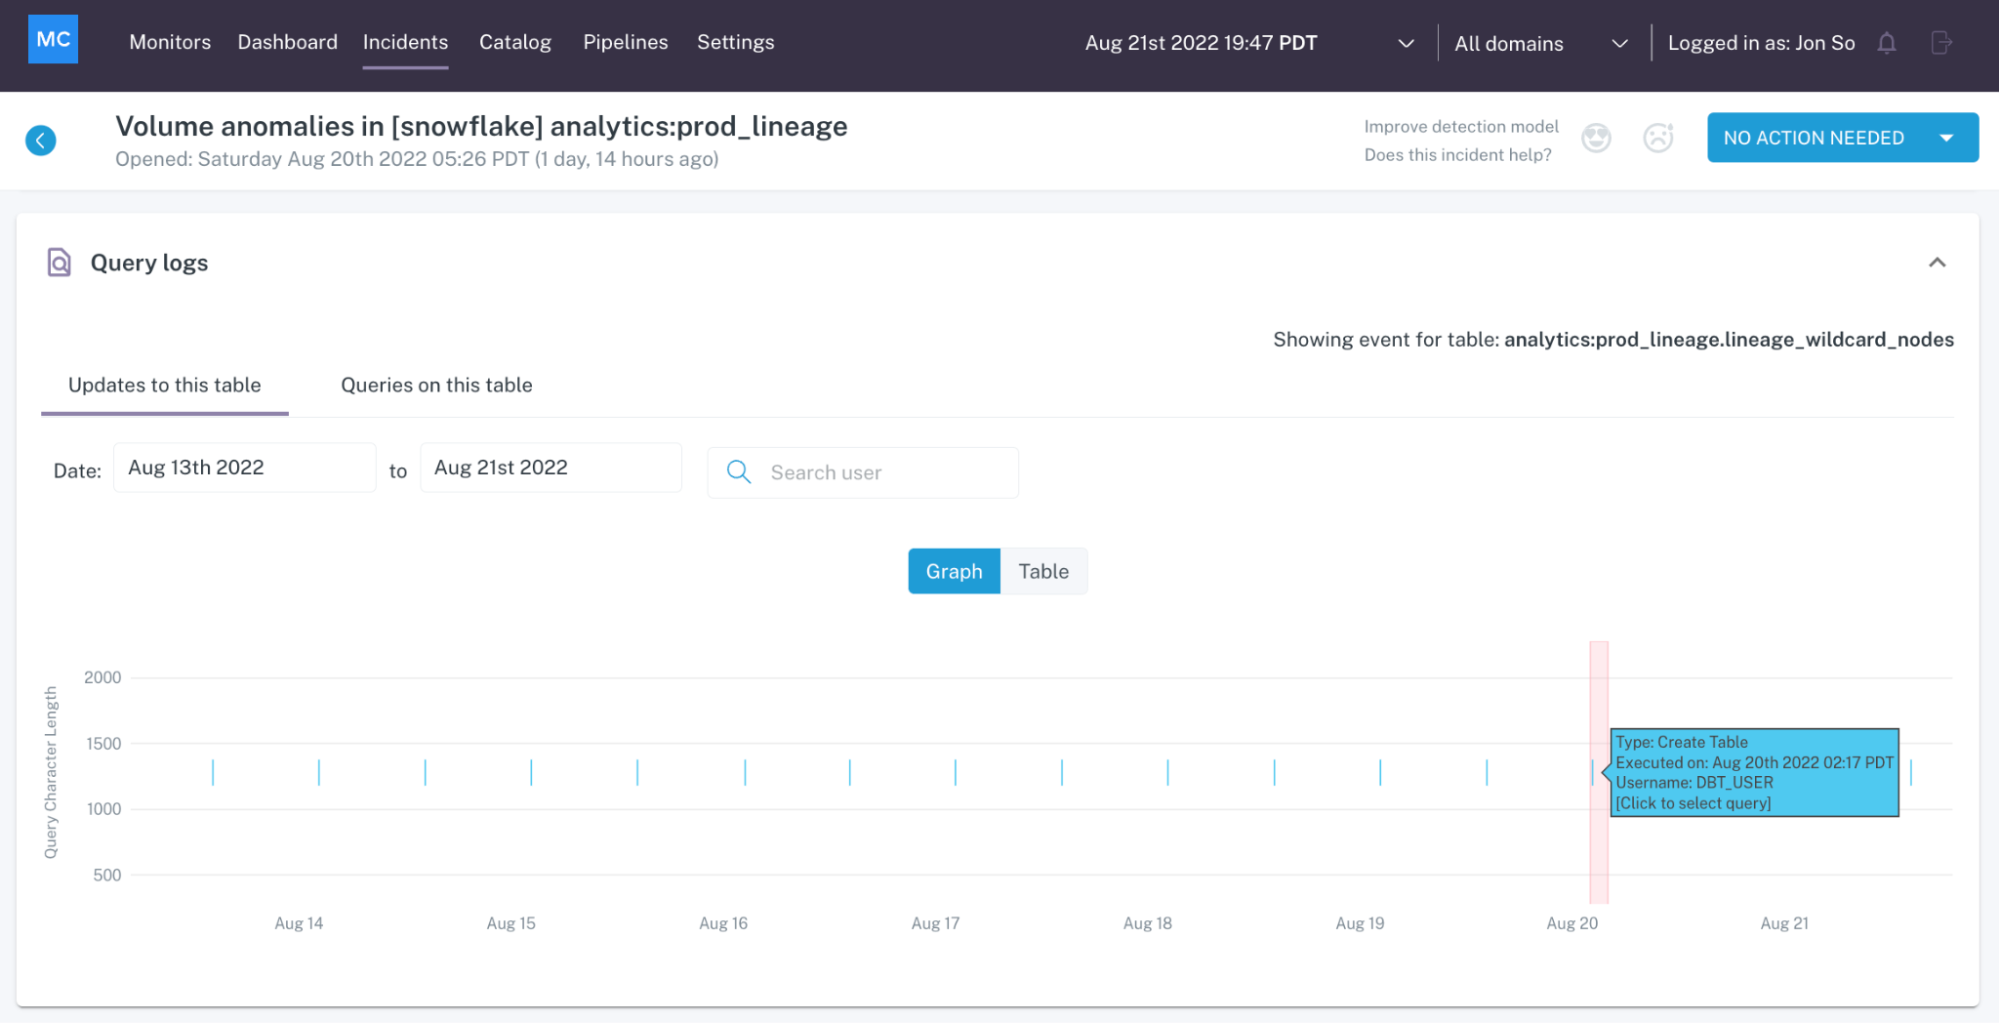
End-to-end integration and log analysis across the stack
Broad coverage also entails end-to-end integration. Without analyzing the logs across each component of your stack, you are blind to how changes in one system may be causing anomalies in another.
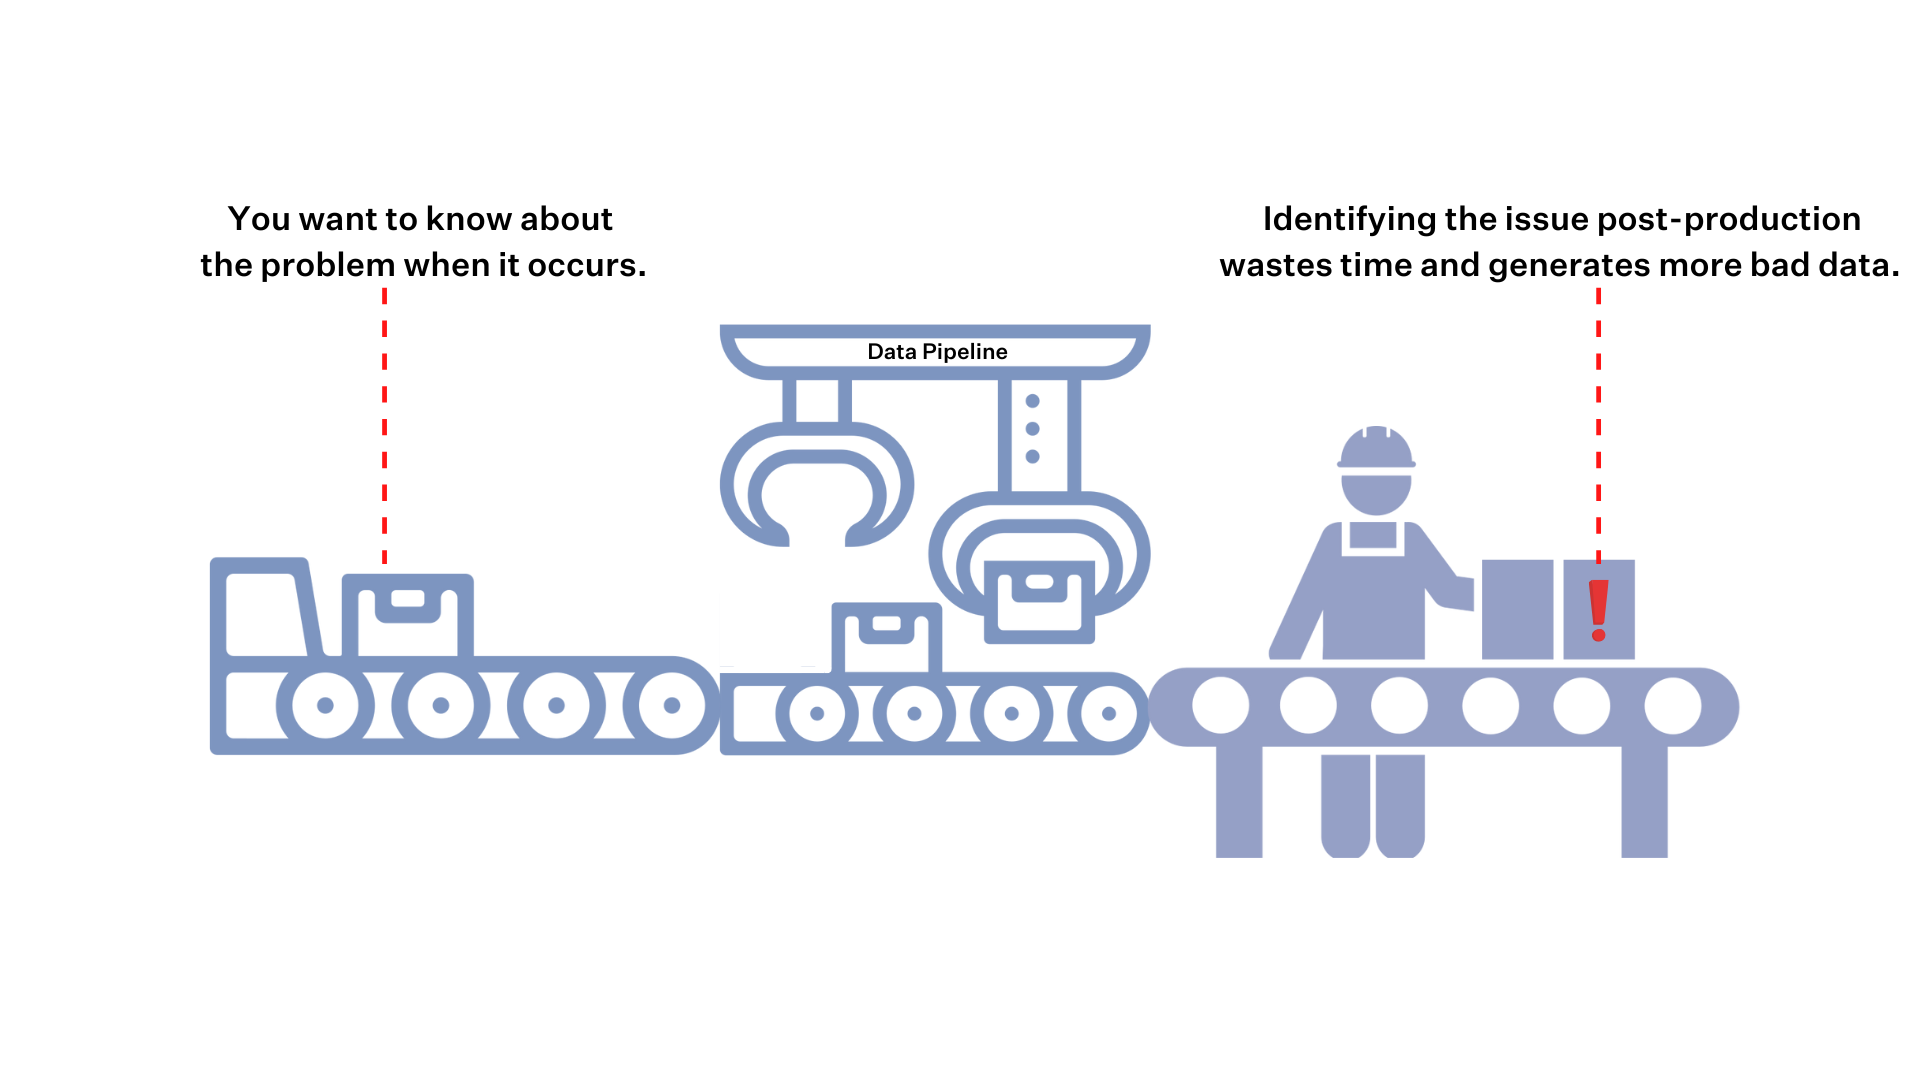
On an assembly line, Tesla doesn’t only put quality controls in place when the Model X is ready to ship to the customer. They check the battery, engine components, and the body at each step along the way.
Shouldn’t we check our data pipelines at each point of failure as well? This includes automatic analysis of the pipeline’s SQL logs to understand any recent changes in the code and logic; Airflow logs to understand failures and delays; and dbt logs to understand errors, delays and test failures.
And the only way to do this cost-effectively and at scale is by analyzing logs across the stack. This approach both covers all your points of failure, and provides additional context to help you prevent future anomalies.
For example, analyzing logs at the BI layer can identify downstream users and data consumption patterns, helping you to more effectively deploy your deep monitors. Identifying logs within the enterprise data warehouse can automatically assess key components of data health such as deteriorating queries or disconnected tables.
The future of data quality monitoring is end-to-end data observability
At the end of the day (or rather, the end of the pipeline), pairing deep data quality monitoring with broad coverage gives you the best of both worlds: end-to-end visibility into your data environment and the tools necessary to quickly address any issues that do arise.
Like our software engineering and DevOps counterparts, we think it’s time to move beyond monitoring and embrace an approach that goes beyond a narrow set of metrics to more actively identify, resolve, and debug complex technical systems. Maybe it’s time we embraced data observability instead.
Interested in learning more? Reach out to Lior, Bryce, and the rest of the Monte Carlo team.
Our promise: we will show you the product.
Read more posts.