Product demo.
  What is data observability?
  What is a data mesh--and how not to mesh it up
  The ULTIMATE Guide To Data Lineage
 10 Quick Tips for Getting Started with Monte Carlo

Hilary Hobel
Hilary Hobel is a customer success manager at Monte Carlo.
To help our users accelerate the adoption of data across their companies, Monte Carlo strives to build products that make achieving data reliability as quick and seamless as possible. (Just ask our customers).
With this in mind, we have created a set of brief tutorials on some of the most popular data observability functionalities that our customers leverage in Monte Carlo to help you get to value quickly.
Let’s get started!
- How to Navigate the UI
Before diving into the features themselves, the first step is making sure you know where to find everything. This video will show you how to navigate our UI and where to find our core Monte Carlo functionalities including: Catalog, Incident IQ, Monitors, and Pipelines.
- How to Use Incident IQ
When a data incident occurs, you can use Incident IQ to view the anomaly’s historical timeline and manage status, ownership, and severity. In this view, you can modify incident summary information like the status and assign an owner, and get an in-depth analysis of the data downtime issue, including an incident timeline, recent query logs, and BI reports affected downstream. In this video, we walk through how to use Incident IQ to conduct quick, automated root cause analysis.
- How to Use Catalog
This video will show you how to navigate the Catalog view to understand the health and reliability of your data assets across your pipeline. With Catalog, you are able to search at the table, report, or field level in order to provide a more granular view of the health and reliability of your data.
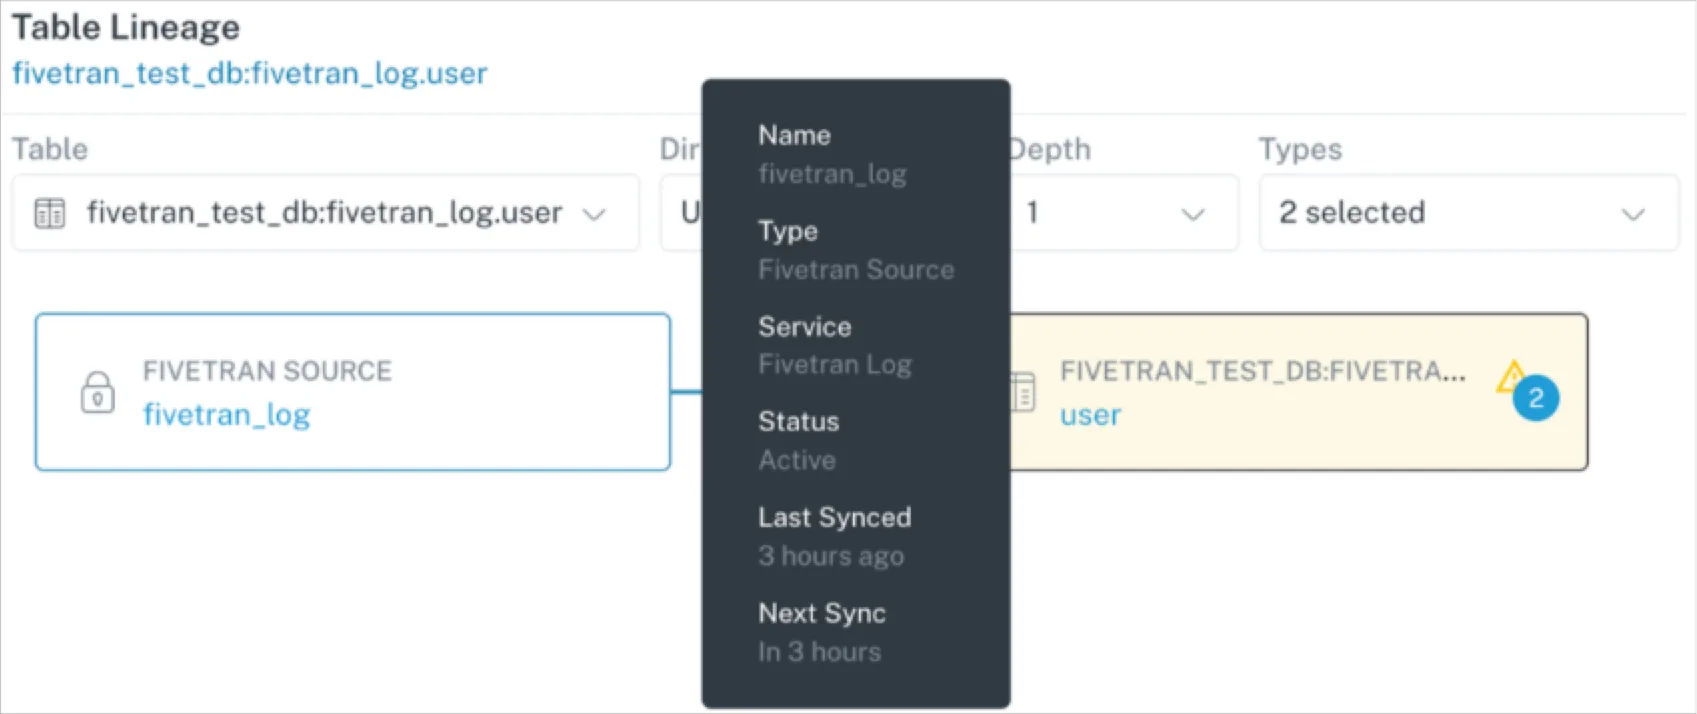
- How to Leverage Field-level Lineage
Monte Carlo’s Field-level Lineage provides a centralized view of the relationships between upstream assets and downstream tables, and gives you direct insight into which dashboards and reports leverage a specific field. Field-level Lineage also allows for a more granular view on your data by informing how the field is being used in either SELECT or NON-SELECT clauses. In this video, we walk you through how to use our Field-level Lineage tool which lets users track field level dependencies among tables and reports.
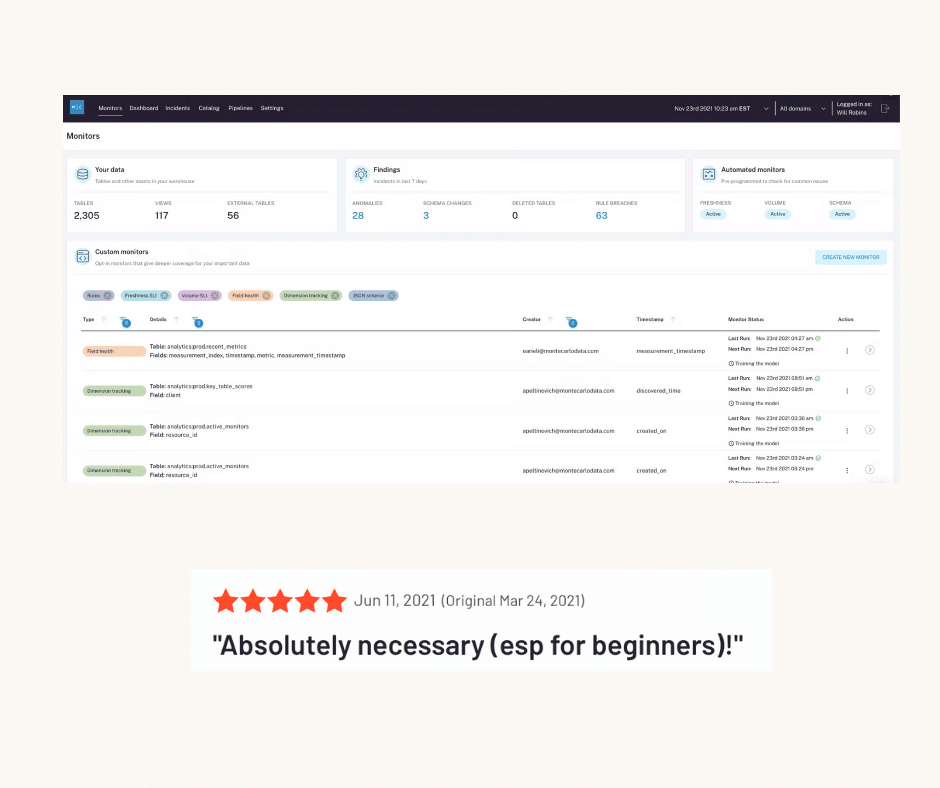
- How to Add Field Health Monitors to Views
You can set up Field Health Monitors for extra insurance and deeper statistical coverage for tables and views that are critical to your business. When applied to a table or view, Field Health Monitors automatically begin tracking and reporting on anomalies across our Field Health Metrics. This video will show you how to set these monitors up and apply them to specific data assets.
- How to Use SQL Rules
While Monte Carlo’s data quality monitors provide automated, end-to-end coverage out of the box, our SQL Rules functionality gives you options to add custom monitors to cover specific use cases. SQL Rules are ideal when you have specific business logic or an explicit threshold that you want to monitor on top of our baseline coverage. In this video, we’ll walk through how to add custom SQL rules to supplement automatic anomaly detection and monitoring within Monte Carlo.
- How to Use Insights
With Insights, you can better understand the operational analytics of your data ecosystem. Many of our customers access this data to define and track service-level indicator (SLI) performance for critical data assets, identify long-running or heavy queries, determine the most important (or least important) data assets, and more. In this video, we walk through how to use Monte Carlo’s Insights functionality to get a holistic pulse on the health of your data pipelines.
- How to Route Alerts to Slack, PagerDuty, Microsoft Teams, Email or Elsewhere
It’s critical to incorporate alerts from Monte Carlo into your workflow and collaboration tools, to dramatically reduce the time to resolution for incidents. Monte Carlo currently supports alerts to Slack, email, PagerDuty, webhooks, Mattermost, Opsgenie, and Microsoft Teams. When setting up an alert with Monte Carlo, you are also able to customize where incidents affecting specific tables or datasets are sent across these communication channels and workflows. In this video, you will learn how to add a notification so the right teams can be informed when there is a data incident.
- How to Mute Incidents
Having coverage across all of your data is a must-have feature of data observability solutions, but you also need an easy way to mute alerts on data sets that don’t require attention (i.e., updates affecting dev or staging tables). Using our Mute functionality, your team can easily turn off alerts for datasets and tables. In this video, you will learn how to mute datasets and tables in Monte Carlo.
- How to Use Domains
With Domains, individuals can focus on the relevant data to their team or business unit and foster greater domain-oriented ownership over critical data assets. This video will show you how to build out separate Domains for your teams within Monte Carlo.
We hope these tips can help you successfully reach data observability with Monte Carlo. If you are looking for more specific onboarding guides, check out our Docs.
Interested in getting started with end-to-end data observability? Book a time to speak with us in the form below.
Our promise: we will show you the product.
Read more posts.