5 Ways to Improve Data Quality with the New Monte Carlo Data Quality Trends Dashboard
Monte Carlo recently launched an updated Dashboard view as part of our efforts to equip our customers with the best tools to tackle their data downtime issues effectively seamlessly.
The Dashboard incorporates data and visualization to provide actionable insights to users across data teams.
Our customers use these features to gain visibility into how their incident levels are trending, the status of incident resolution, the health of custom monitors, team specific data, and other data health insights.
Here are 5 of the most valuable ways you can leverage Monte Carlo’s Dashboard.
Track incident trends with a bird’s-eye view:
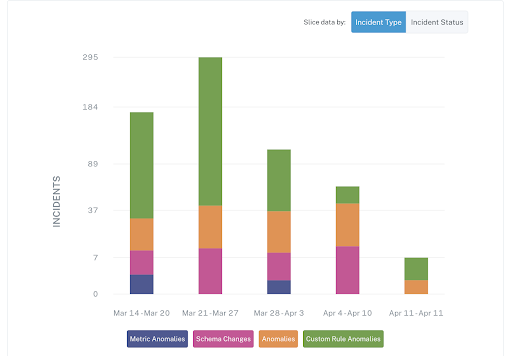
This Dashboard chart shows incidents broken down into different types: metric anomalies, schema changes, anomalies, and custom rule anomalies.
This gives data leaders a quick way to identify trends in terms of number of incidents as well as the types of incidents without having to dive deep into the underlying data.
In the example shown above, you can see from the week of March 21 forwards, the number of incidents consistently decreases, with April 4-10 week’s metric anomalies completely eliminated. Any actions taken to mitigate these anomalies should be applied across the data warehouse/data lake to promote healthy data observability habits.
Tackle unresolved data downtime issues in weekly team reviews:
Monte Carlo notifies users when a data issue arises, and our platform does an excellent job keeping track of when and how said issue is resolved.
This Incident Status chart shows the breakdown of incidents in different stages of the cycle: from No Status, to Investigating, to Fixed.
This gives your data team an opportunity to review and ensure data downtime issues are being actively addressed.
This chart is also helpful when it comes to improving performance and user experience in Monte Carlo.
If you have Freshness issues consistently classified as “No action needed” you can easily adjust the minimum freshness threshold. If you have Schema Changes issues consistently classified as “Expected,” it might mean the schemas are being actively worked on, in which case you can verify that is indeed the case and then mute these alerts.
Identify Misconfigured or Erroring custom monitors:

Within the Dashboards view, you can quickly scan the Monitors section to get an overview of your custom monitors and their current statuses.
If you are seeing Misconfigured or Erroring monitors that are not expected, you can easily navigate to the Monitors view, filter by Status and review these monitor(s). Reviewing custom monitors often ensures that your Monte Carlo environment is organized and your experience is seamless.
Identify your most engaged teams using Domains:
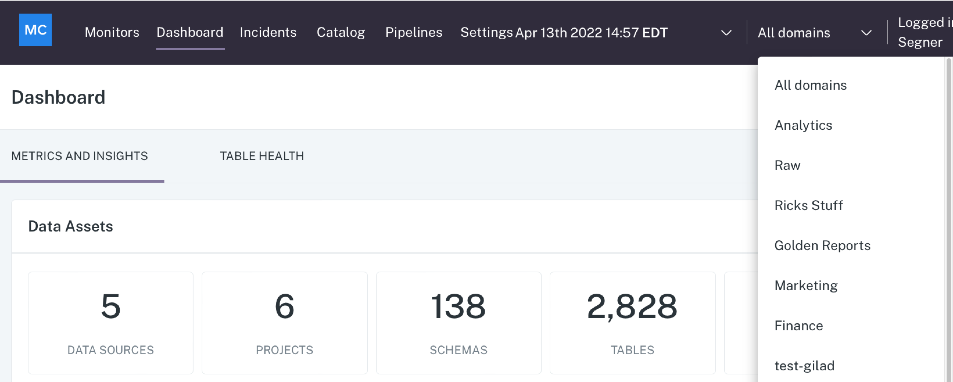
Monte Carlo also provides you with the ability to select a specific domain for a more detailed look into your team of interest.
This way, individual teams have access to a clean view into their data without having to parse through the entire organization. Furthermore, this feature creates a collaboration space where if one team’s or domain’s data downtime performance is better than another, you can compare practices and pipelines to improve the overall performance of your organization.
For an executive, having the ability to filter the view down to the specific team makes it easier to see and reward teams that are building good data observability habits.
Knowledge sharing and collaborating to expand what works and mitigate what doesn’t across your organization is the key to archiving a healthy data ecosystem.
Use Insights to dive deep to improve performance:
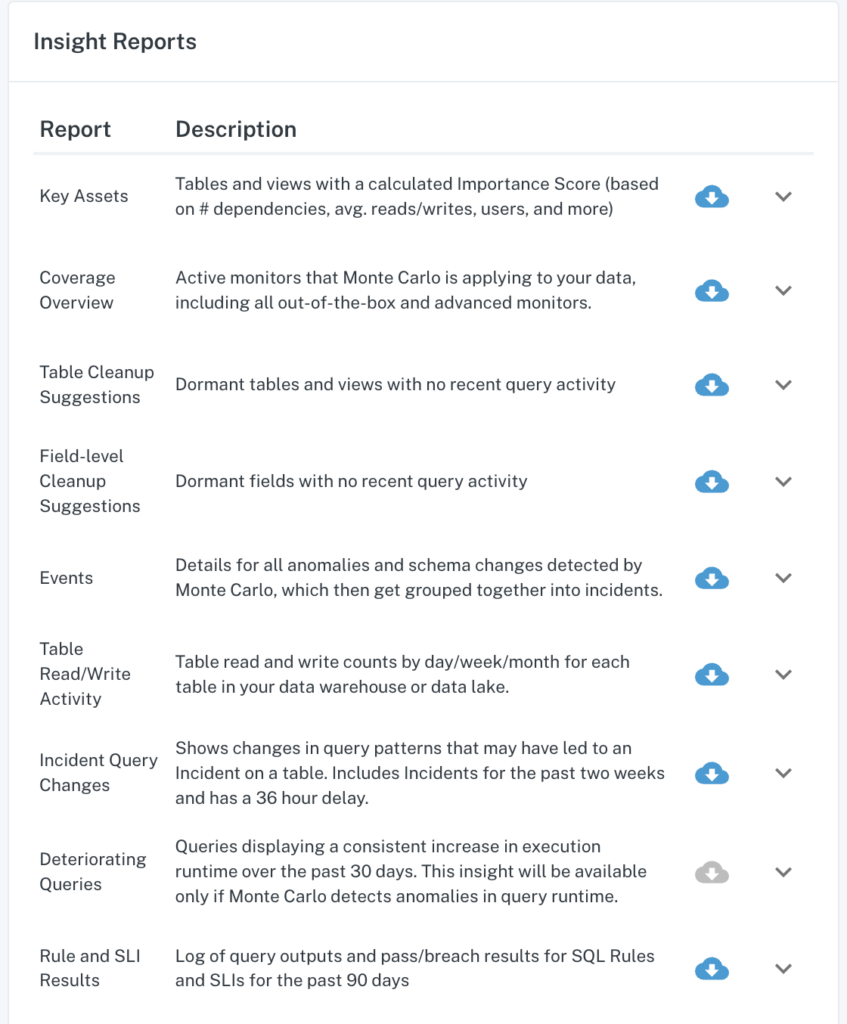
Monte Carlo generates dozens of Insight Reports to aid your data teams with tools to make the most informed and efficient decisions to minimize downtime and resource consumption.
Some of the newest reports that we are excited to share with you are:
- Heavy Queries: Queries from the last week with the longest runtime and most bytes scanned. The top 5 queries are shown for each warehouse and executor. This can be used to find and optimize queries that are causing performance issues or stressing resources.
- BI Dashboard Analytics: Usage data for Looker dashboards such as totals views and days since last view. This can be used to decide which dashboards are safe to deprecate or delete as well as identify heavily used dashboards in a migration.
- Field Health Suggestions: Top 100 table recommendations for Field Health monitors, based on Table Importance Score. This can be used to define important tables to be added to Field Health custom monitors.
Those are just a few ways that you and your team can use Monte Carlo functionalities today, but the possibilities are endless. If you are looking for even more comprehensive guides and documentation, visit our Docs!
Book a time to speak with us in the form below if you have any questions about how we can help your team gain deeper insights on your data incidents, health, and performance.
Our promise: we will show you the product.
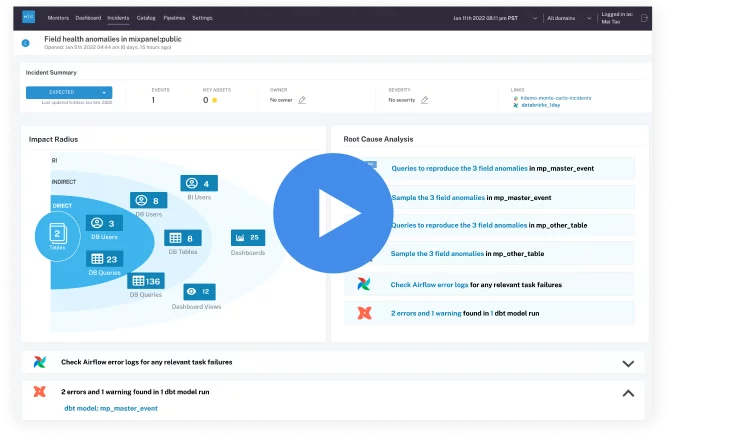 Product demo.
 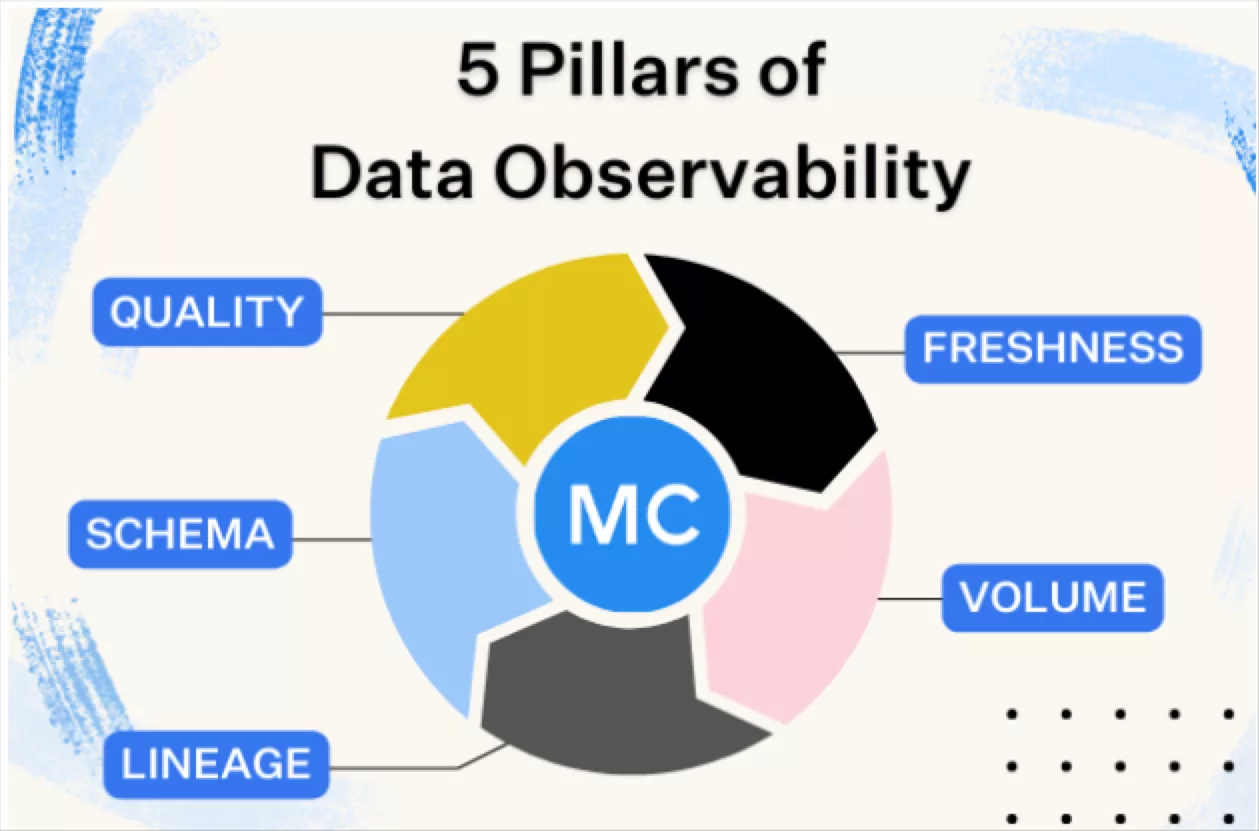 What is data observability?
  What is a data mesh--and how not to mesh it up
  The ULTIMATE Guide To Data Lineage


