A 5-Step Incident Management Framework for Enterprise Data Organizations

There are a few adages that stand the test of time. “Better late than never.” “Actions speak louder than words.” “Two wrongs don’t make a right.” And, perhaps the most important:
“You can’t improve data quality without incident management.”
Which leaves a lot of data teams decidedly not improving their data quality—despite their best efforts to the contrary.
The sad reality is that, even in today’s modern data landscape, incident management is often largely ad hoc—with detection only spurned into action when bad data makes its way into production. And this reactionary approach to incident management undermines many teams’ efforts to operationalize and scale data quality programs over time.
So, how are the best data teams in the world moving from reactive to proactive?
We’ve compiled the five most important steps to effective incident management, plus some best practices we’ve seen work well.
Table of Contents
How to create a proactive incident management process
Let’s consider a hypothetical. Imagine a data quality issue is discovered in a critical pipeline powering one of your executive dashboards.
The typical “incident management process” goes something like this:
- The stakeholder pings the analyst for help
- The analyst pings the data engineer to find and resolve the issue
- The data engineer makes a (mostly) gut decision to either add the issue to their endless backlog or parse an endless labyrinth of systems and pipelines to root-cause it
- Days pass… maybe weeks… possibly months…
- Eventually a determined data engineer bypasses several red herrings to discover the smoking gun
- The issue is resolved
- The stakeholder is notified
- Another issue surfaces… and the cycle continues until the sun burns out.
If you’re a governance leader, this probably feels all too real.
But what if your team had a real data quality management playbook? Some formal process that codifies data incident management so your team can jump into action instead of scrambling for answers?
This isn’t a new concept; software engineers have been employing incident management processes for decades.
So how do you implement this for data quality?
Step 0: Prepare
Before you can take the first step toward proactive incident management, you need to lay the groundwork.
First, you need to clearly define exactly what each stakeholder will do, including how and when to respond in the event of a data incident. This can be done through the following six steps.
You’ll need to:
- Set up your notification channels. Does your team use Slack? Microsoft Teams? JIRA? Create specific channels for data quality issues leveraging the communication tools you already use.
- Agree on incident response SLAs. Teams typically determine SLAs for triage by severity. How quickly should each incident level be prioritized? What should stakeholders, domain teams, and engineers expect?
- Classify domain and asset ownership. One of the most important steps when it comes to a data quality program is understanding who owns what. This can look different for every organization, so determine what makes sense based on your data team structure.
- Pre-classify asset and issue priority. Understand at the outset what matters most when tests are triggered. Severity levels like a scale from 1 to 3 will simplify triaging and ensure you’re acting on the most critical issues first.
- Tag owners to alert stakeholders when things break. Assigning this responsibility to certain individuals will ensure that issues aren’t missed by the domain or asset owner.
- Document this process and put it in a publicly accessible location. At Monte Carlo, we use Notion, but whatever tool you use, ensure you keep this information readily available.

With these steps in place, you’re ready to start building incident management into your data quality program.
Step 1: Detection
Setting up data quality monitors across your critical domains and data products will alert incident owners to shifts in the data’s profile, failed validations, and more.
There are two types of monitors that you should deploy to provide visibility into the health of your data at different levels: baseline rules and business rules.
Baseline rules
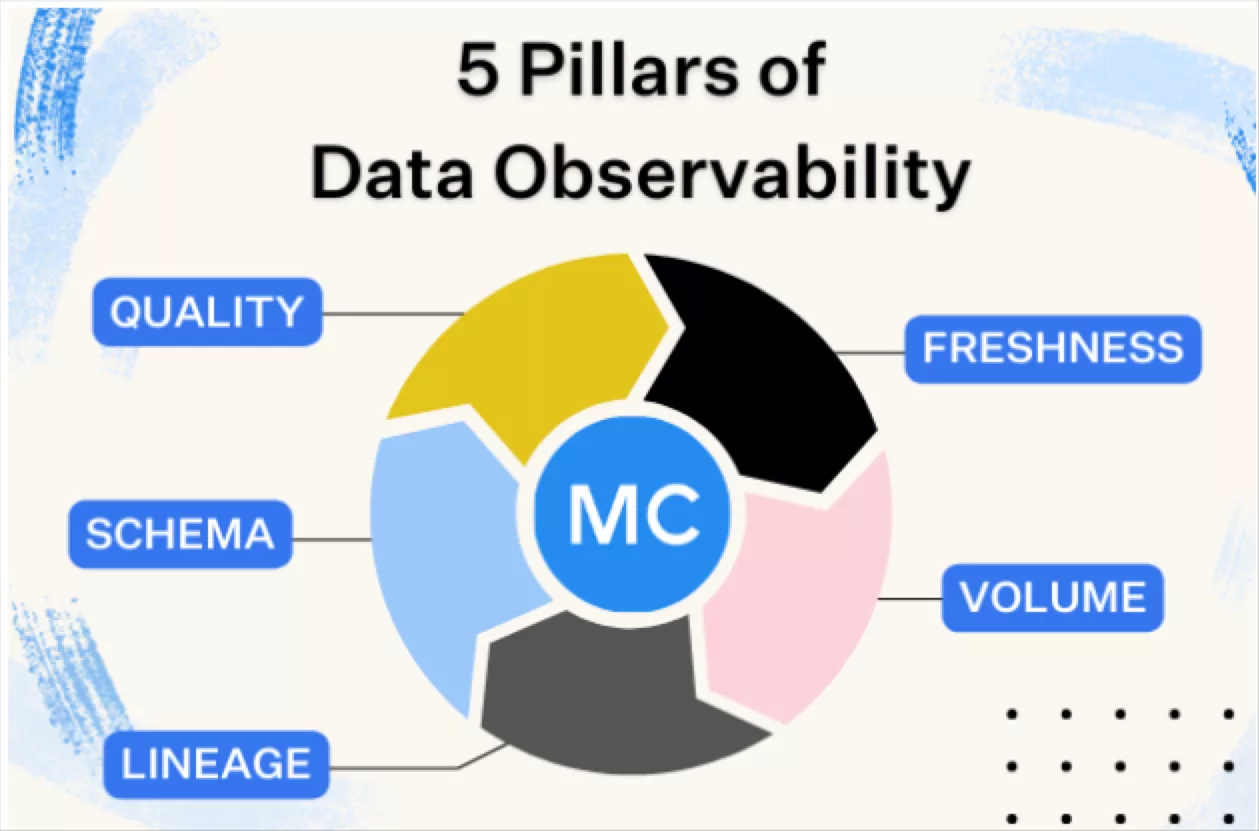
First things first, you want to ensure that your core baseline rules are covered by automated monitors – this means automation for freshness, volume, and schema changes. Monte Carlo instantly deploys broad monitoring of your data pipelines for changes to these dimensions with no manual configuration required.
Teams can also set up monitors for metrics as well, which are ideal for detecting breakages, outliers, “unknown unknowns,” and anomalies within specific segments of data.

Business logic rules
In addition, data teams should also leverage validation monitors, SQL rules, and comparison rules to add tailored coverage for specific use cases. These are ideal when you have specific business logic or an explicit threshold that you want to monitor on top of your baseline coverage.
With Monte Carlo, teams can choose from templates or write their own SQL to check specific qualities of the data, set up row-by-row validations, monitor business-specific logic, or compare metrics across multiple sources.

When you’re setting up the detection strategy for an incident management process, we recommend leveraging both types of monitors on your most critical data assets. From there, you can scale up.
Pro tip: The most effective way to ensure your team catches data quality issues – including the issues you haven’t thought of yet – is to leverage AI-enabled monitors that recommend, set, and maintain thresholds based on historical data.
Step 2: Triage
A robust “on-call” triage process allows enterprise data teams to focus on impact first. This can also cut down on context switching for the wider team and ensures that time is being spent where it will matter the most.
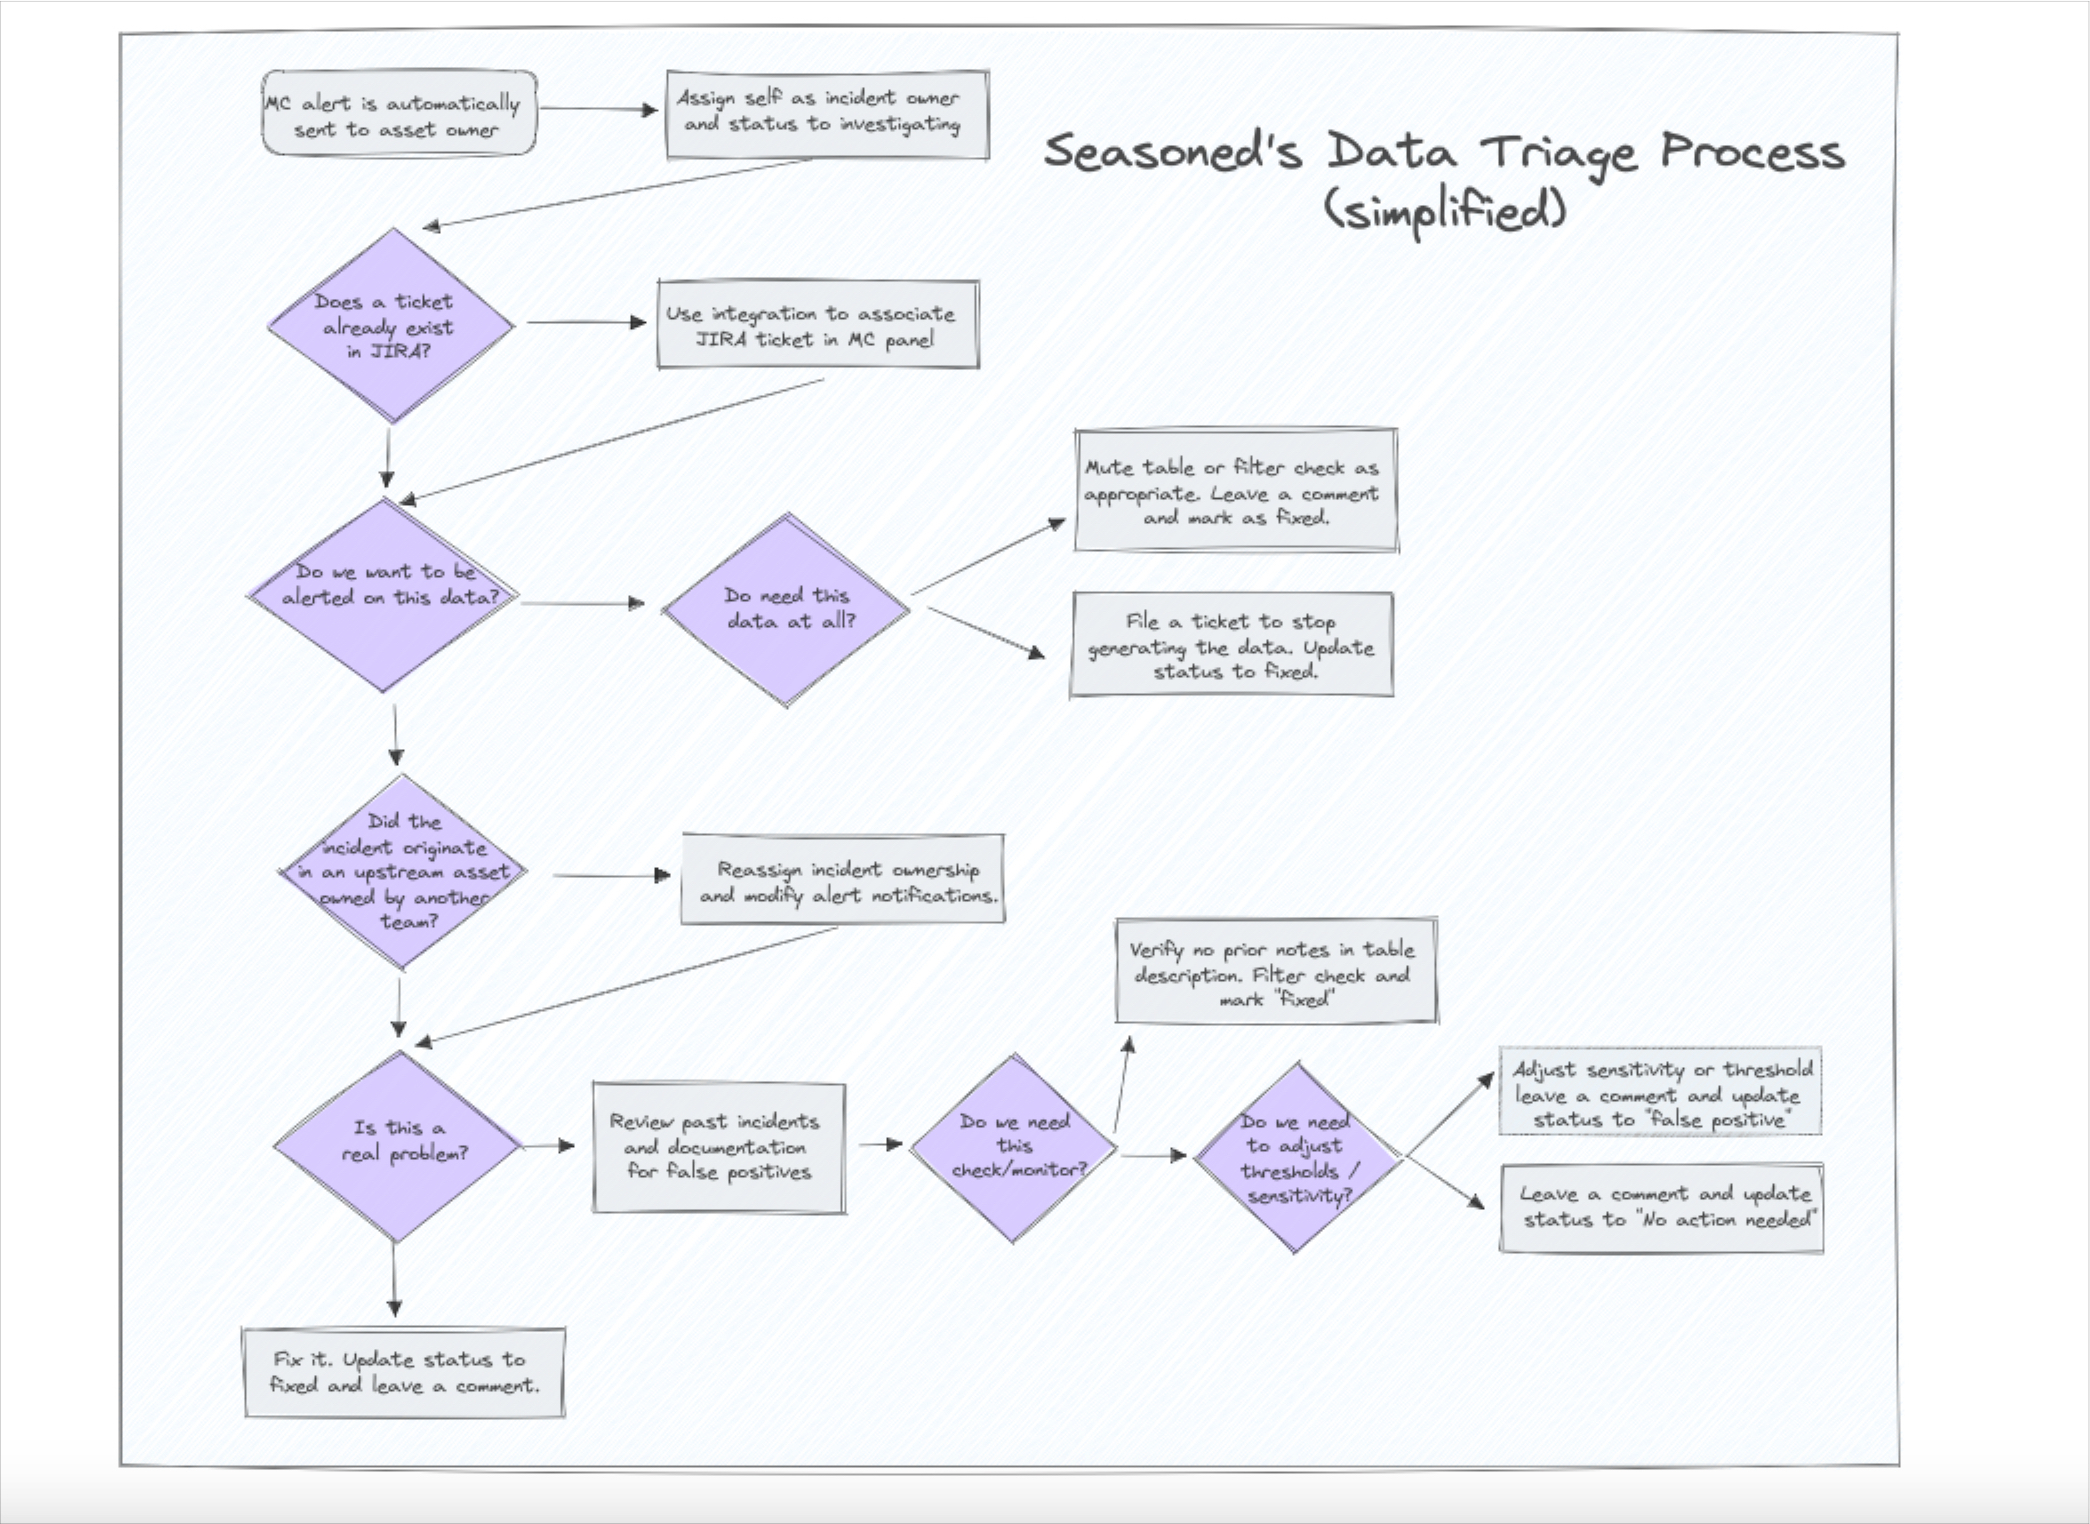
Based on the ownership determined in Stage 0, the appropriate on-call recipient will begin a triage process that looks something like this:
- Acknowledge the alert. Depending on the tools you use, either “react” to the alert, leave a comment, or take whatever action makes sense to show that it’s been seen and action will be taken.
- If the alert is not an incident, change the status. Typically, enterprise data teams use the following status options: Fixed, Expected, No Action Needed, and False Positive.
- Set the severity. If you’ve established a numerical or qualitative range for severity, assign the appropriate level.
- Set the owner. Based on the domain and asset owners determined in the preparation stage, assign the appropriate owner.
- Open a JIRA ticket if required. If your team uses a tool other than JIRA, set up a ticket via the relevant service.
Once the triage process is complete, the data issue has officially become the owner’s responsibility to resolve.
Step 3: Investigate
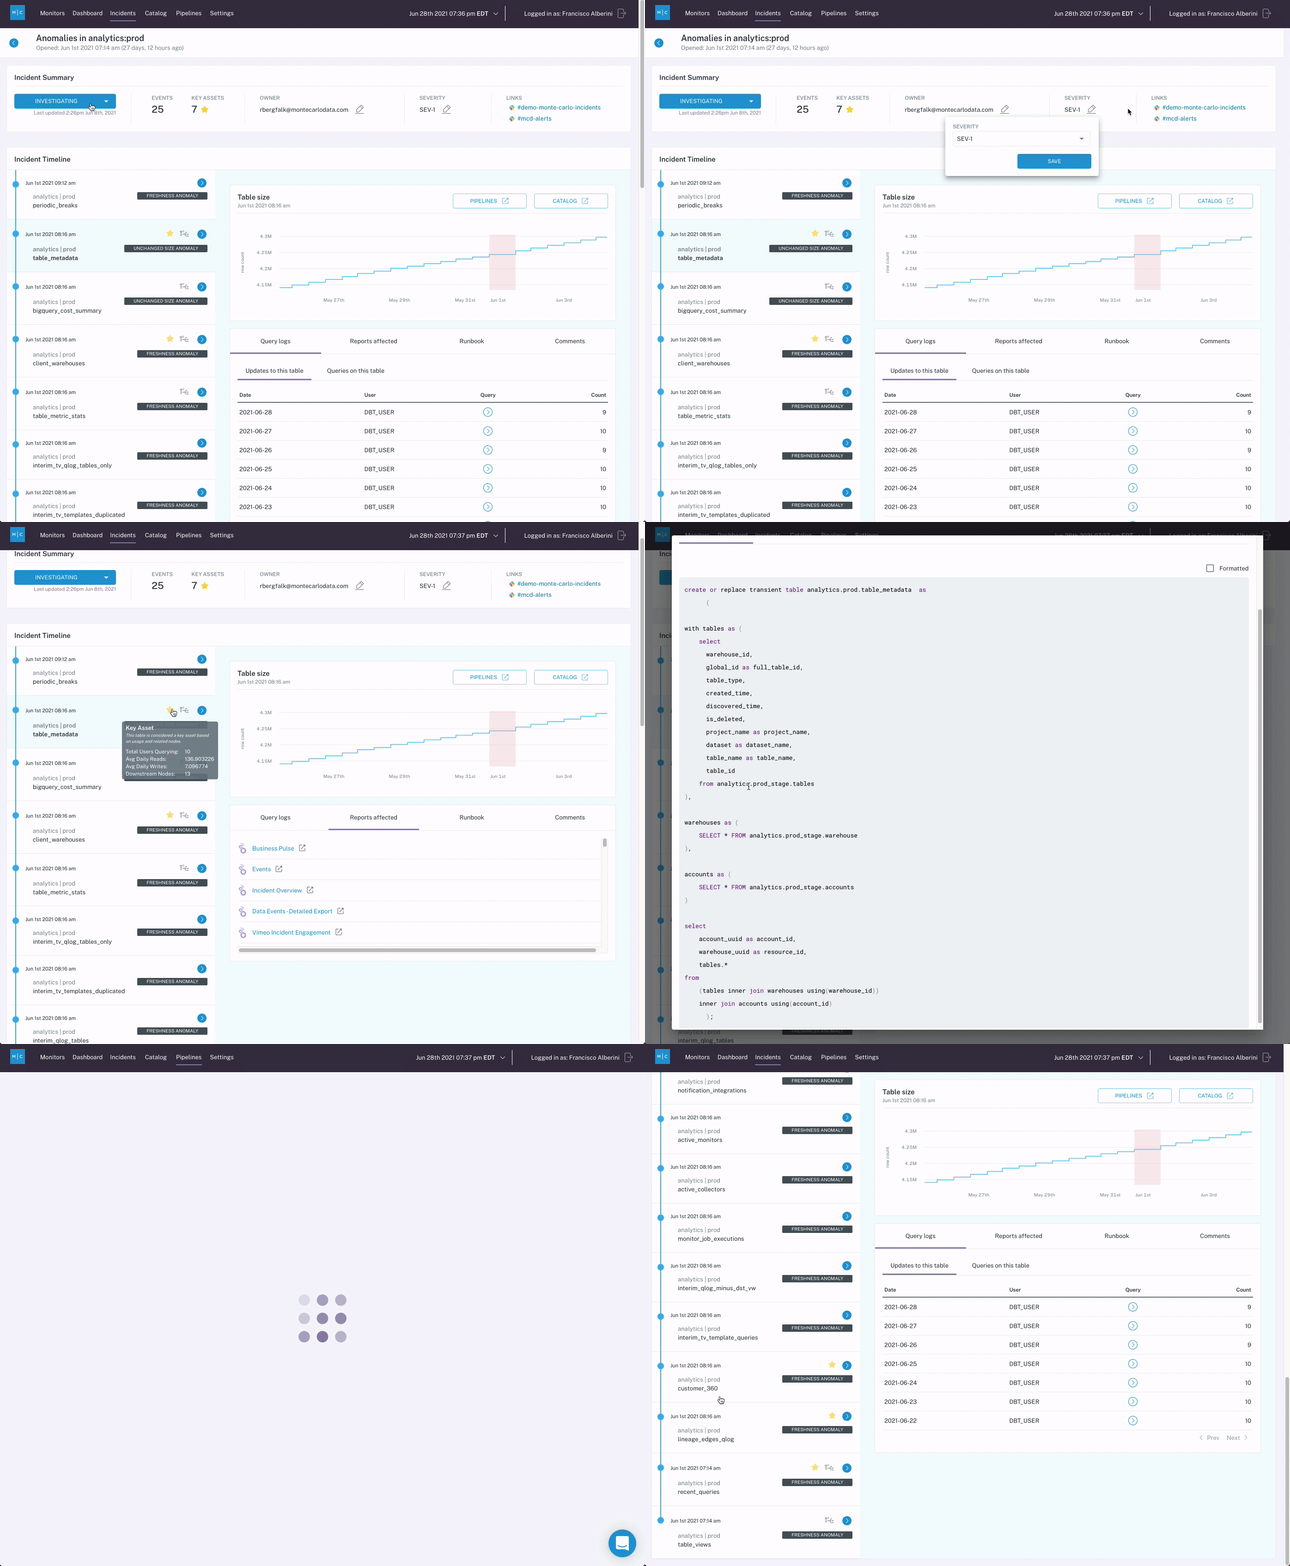
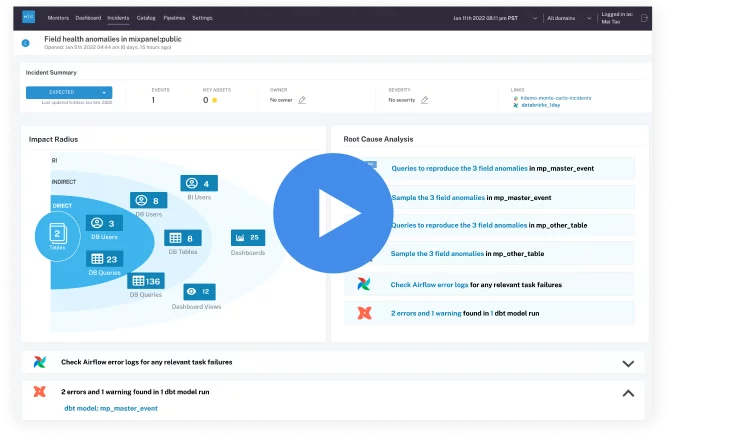
A tool like Monte Carlo can simplify the investigation process as well. Several features, including root cause insights, assets metadata, and data lineage enable incident owners to identify the root cause of an incident quickly.
Using these features, stakeholders can follow the following steps to investigate the root cause of a data issue:
- Review the incident’s root cause analysis (RCA) insights. These automated findings use query logs, lineage information, and the content of the table to facilitate the discovery of the root cause of a particular data incident and identify correlation insights.
- Review affected tables and jobs, and investigate the data lineage. The lineage will provide a visualization of how the data moves within your environment to illustrate where the issue might have occurred and how it might impact downstream dependencies.
- Reproduce the anomaly in your data lake or data warehouse. Attempting to reproduce the anomaly can provide more exact insights into how the issue might have occurred.
- Review past incidents on the table or job for context. Has this issue occurred before? When? How often? This context can help determine if there’s a larger issue that needs to be addressed.

Step: 4: Resolution
Once you’ve triaged, investigated, and located the root cause, it’s time to resolve the issue for good. First, review your operations metrics to understand what’s been impacted, and communicate what you know to the relevant data consumers.
Then, begin the resolution process:
- Fix the issue and deploy the fix. Woohoo! The pipeline is back in order.
- Add a comment. Need to call anything out about this particular issue? Make sure to share pertinent information for teams to use as context in case of additional issues in the future.
- Update the status. Isn’t it a great feeling to update something to “Resolved”?
- Inform data consumers. If any downstream stakeholders were waiting for this issue to be resolved, make sure to tell them that it’s been fixed.
- Document the “value story.” Keep a written record of exactly what went wrong, how it was fixed, and how that fix impacted the business downstream. Your team can use this information to showcase the value of your data quality program later on.
Step 5: Retrospective
A retrospective can be critical for understanding how effectively your monitoring strategy is covering your business needs and if there’s any room for improvement.
If a data issue uncovered a previously unknown gap in the pipeline, it’s typically smart to hold a retrospective to get more insight into why it happened and how it was resolved.
A typical retrospective process reviews the incident with the team and addresses the following questions:
- Did this meet the SLA?
- What was the time to response?
- What was the time to resolution?
- Is additional monitoring required to cover an issue like this?
- Are the current monitor thresholds adequate?
Based on the answers to these questions, document the learnings and ensure they’re readily available using whatever knowledge sharing tool your organization is currently using.
Incident management best practices
These five steps are just one example of an effective incident management process. Over the years, we’ve seen enterprise data teams tailor incident management to all kinds of unique situations—from centralized ownership to federated architectures, microservices, and more.
Whatever your specific circumstances, there are a few best practices that will help you keep your incident management process running smoothly.
Pre-classify alerts & incidents
We mentioned this in Step 0, but it’s important enough that it’s worth saying twice.
The truth is, not all alerts are incidents. And you absolutely shouldn’t treat them like they are.
Excessive low-value alerts is the primary cause of alert fatigue. Even with the greatest data quality tooling at your disposal, your team only has so much time to respond to issues. Pre-classifying the priority of monitors will help enable data issue owners to more easily focus on assets with a higher importance score and ensure that the most critical issues are actually the ones that get resolved first.
Separate schema changes
It’s important to note that not all schema changes will break a pipeline. Some occur and sort themselves out over time. Rather than wasting time investigating alerts that don’t require attention, reduce overall alert fatigue by moving schema changes into a daily digest or their own dedicated notification channel.
When a schema issue is critical, the pre-classified alerts will ensure that the owner is notified in a timely manner.
Surface insights by tagging
Tagging is a secret weapon for many enterprise data teams. By leveraging tagging, data owners can surface key value pairs as part of the incident notification.
Simply add {{owner}} and directly target the individual or team responsible for resolving the issue.
Automate, automate, automate
The most important takeaway? Your data quality program may be robust, but automating incident detection and management is the key to its success.
Automated monitoring and alerting—including ML-based thresholds—is the only way to effectively manage data quality incidents at scale.
Data organizations can leverage dedicated technologies like data observability to programmatically detect, triage, resolve, and measure data reliability—increasing trust and ROI of the data in the process.
If you want to learn more about how your team can implement a proactive incident management process, let us know in the form below!
Our promise: we will show you the product.
Frequently Asked Questions
What is data incident management?
Data incident management is a structured process for detecting, triaging, investigating, resolving, and reflecting on data quality issues that arise in data pipelines. It aims to proactively manage and resolve issues to maintain data reliability and quality.
What is an example of an incident management system?
An example of an incident management system would be a process using tools like Monte Carlo’s data observability platform, which automatically detects data anomalies, assigns ownership, and helps resolve data quality incidents.
What is a data incident?
A data incident refers to any disruption or anomaly in a data pipeline or system that leads to issues such as incorrect, missing, or inconsistent data, potentially impacting business processes or decision-making.
 Product demo.
  What is data observability?
  What is a data mesh--and how not to mesh it up
  The ULTIMATE Guide To Data Lineage
