Your Guide to Building the Perfect Data Quality Dashboard

Picture this: You’re leading a meeting, ready to present the latest sales figures. But, as you start sharing the numbers, someone points out a glaring inconsistency.
Suddenly, the room is filled with doubt—about the data, the insights, and, let’s face it, even your judgment. A data quality dashboard is your safety net in these situations. It’s more than a tool—it’s a real-time report card on the health of your data.
Table of Contents
What is the purpose of a data quality dashboard?
A data quality dashboard provides a visual overview of the key metrics and indicators related to the quality of your company’s data. It helps you monitor data completeness, consistency, accuracy, timeliness, validity, and more. In other words, it’s a one-stop shop to ensure your data is trustworthy and reliable. Whether you’re a data engineer, a business analyst, or someone who just wants to make decisions without second-guessing every number, a data quality dashboard is for you.
Why monitoring data quality is crucial
Let’s cut to the chase—if you don’t know the quality of your data, you’re flying blind. Here’s why monitoring data quality is a must:
- Make Better Decisions Faster: A data quality dashboard ensures leaders have accurate, reliable data at their fingertips, reducing decision paralysis and guesswork.
- Build Trust Across Teams: A strong data quality framework shows everyone—from the C-suite to the frontline—that you take data integrity seriously. Trust is built on consistency, and a data quality dashboard delivers just that.
- Boost Efficiency and Avoid Data Fire Drills: Chasing down data issues when you need answers the most is exhausting. A solid data quality dashboard alerts you to problems before they spiral out of control, saving you from endless meetings and confusion.
- Stay Compliant and Avoid Costly Mistakes: Data regulations are constantly evolving. Dashboards keep tabs on the metrics that matter for compliance, so you’re not caught off guard by an audit or new data privacy law.
6 must-have metrics for your data quality dashboard
So, what should you track on your data quality dashboard? The right metrics can save you a lot of headaches. Here are the key ones:
- Accuracy: Does the data match real-world values or established standards? Ensuring accuracy prevents flawed analyses and bad decisions.
- Completeness: Are all required data points present? Missing data leads to incomplete insights, which can skew decisions.
- Consistency: Is the data telling the same story across different systems? Inconsistencies create confusion and undermine trust.
- Timeliness: Is your data up-to-date when you need it? Timeliness ensures you’re working with the freshest data, crucial for time-sensitive decisions.
- Validity: Does your data follow predefined formats and standards? Validity checks keep data aligned with business rules.
- Uniqueness: Are there duplicates? This metric identifies redundant records that could throw off your analytics or inflate storage costs.
Best practices for building data quality dashboards
Building a data quality dashboard isn’t just about throwing together some metrics. Here are tips to make sure your dashboard gets used—and makes a difference:
- Start with Clear Objectives: Before diving into design, define your goals. Your dashboard should align with your company’s broader objectives. Are you focused on improving customer experience or boosting operational efficiency? Keep those objectives in mind.
- Get Stakeholders Involved: Involve stakeholders from different departments early in the process. Their input will help the dashboard meet diverse needs and avoid the “we never use this” syndrome.
- Integrate Across Systems: For a full picture of your data quality, integrate data from all corners of the company. Silos are the enemy—break them down with proper integration.
- Design for Usability: Make your dashboard intuitive and user-friendly to empower users, not intimidate them.
Real-life example: Yotpo’s success with a data quality dashboard
Let’s look at a real-life example where a data quality dashboard made all the difference.
Yotpo, a fast-growing eCommerce retention marketing platform, faced data complexity issues as they scaled. Their unreliable data led to costly “fire drills,” where teams frantically tried to fix issues instead of focusing on growth, and trust in the data plummeted.

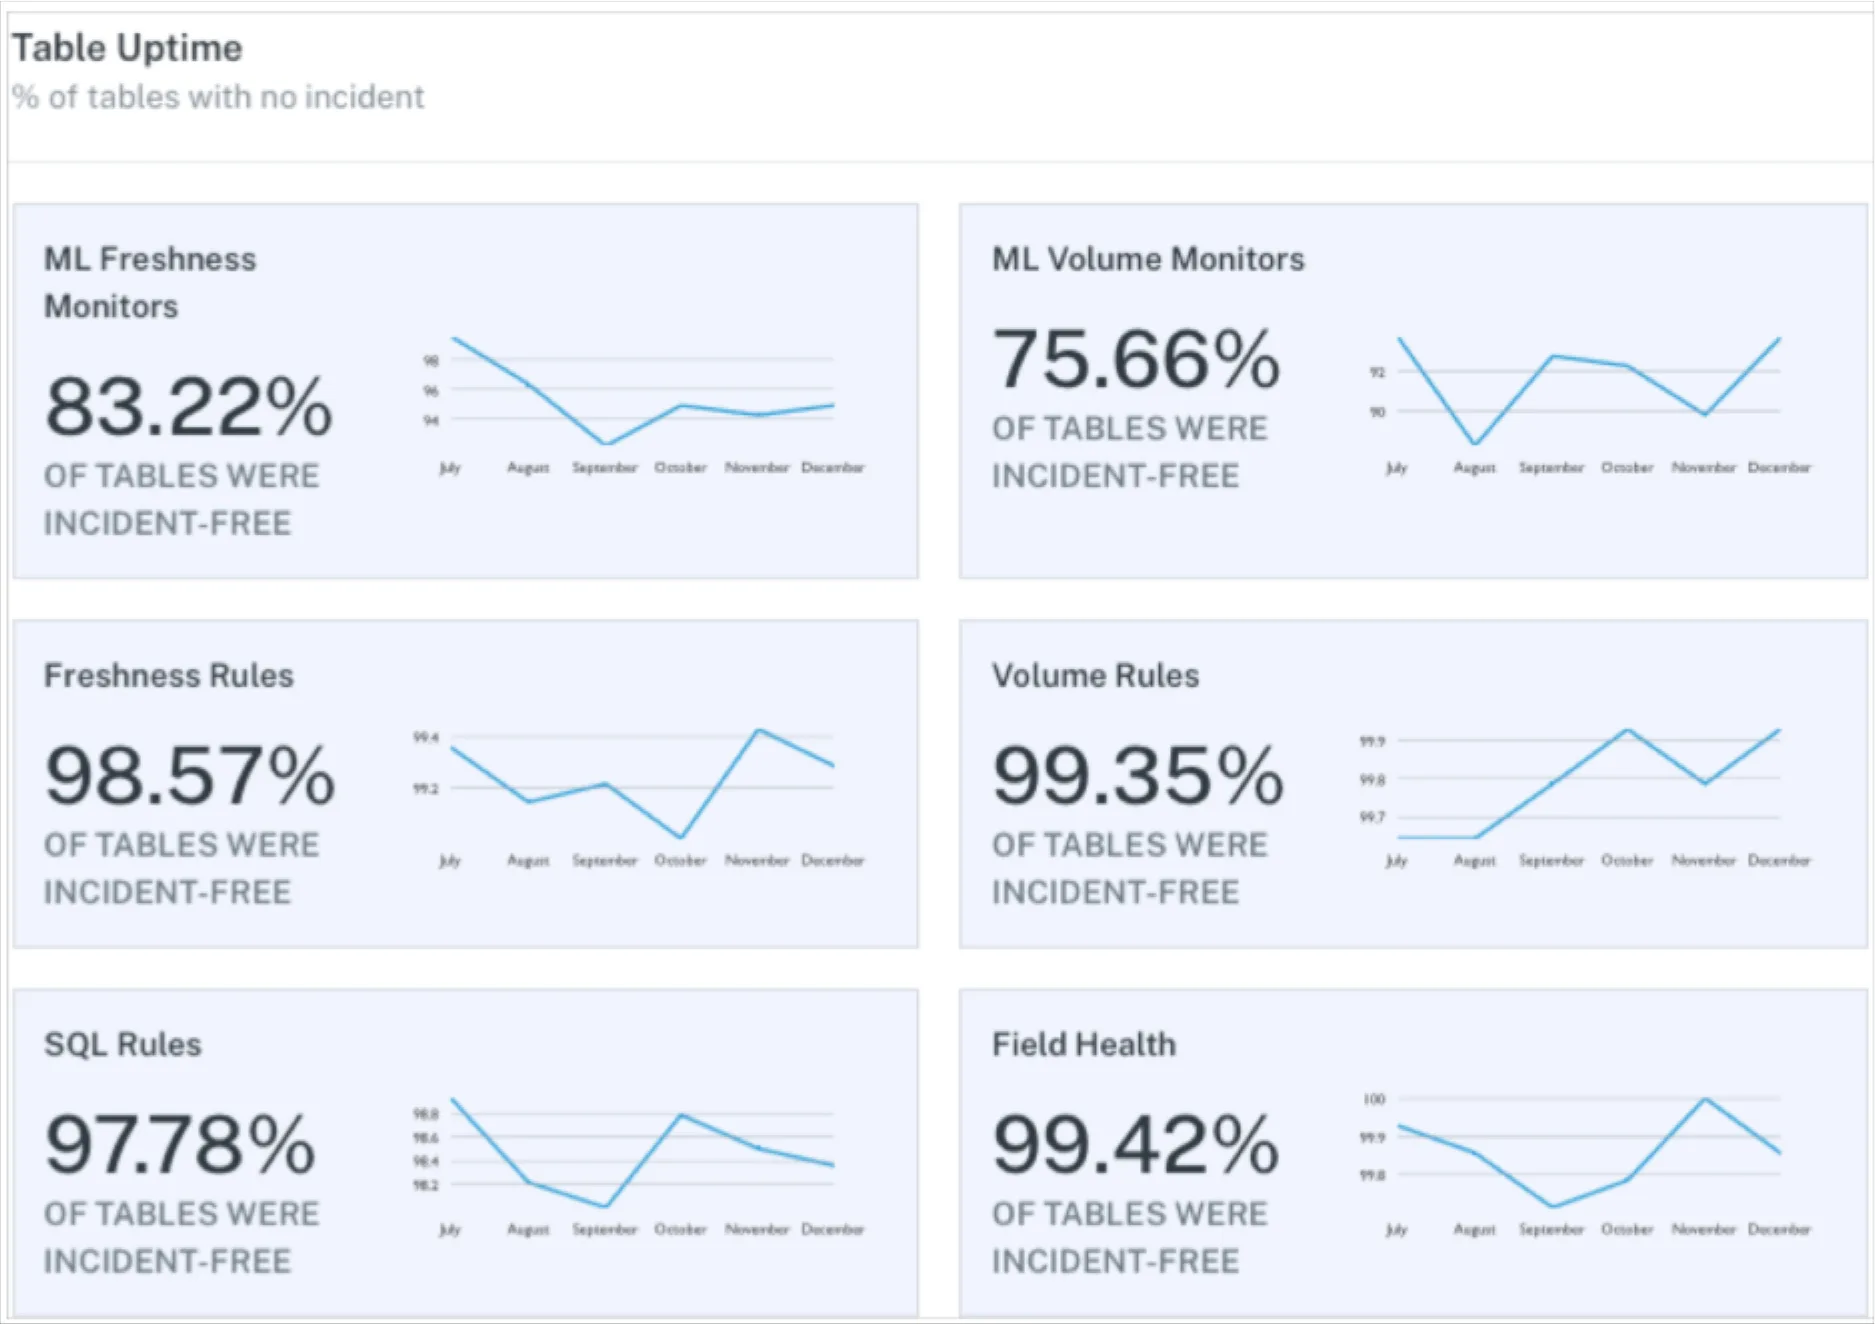
An example data quality dashboard showing alerts over the past month.
Yotpo turned to Monte Carlo to tackle their data quality challenges. Using Monte Carlo’s data observability platform, they implemented automatic monitoring of data freshness, distribution, volume, schema, and lineage, allowing them to catch issues before they escalated. The result? No more scrambling or finger-pointing—just quick, efficient resolutions and renewed trust in their data.
Deliver insights with data quality dashboards from Monte Carlo
Let’s be honest—building the perfect data quality dashboard isn’t easy. With end-to-end data observability, pre-built dashboards take the guesswork out of monitoring and improving data quality.
With features like automatic anomaly detection, lineage tracking, and a comprehensive data catalog, you get deep insights into your data’s health without drowning in manual settings and spreadsheets.
The result? Actionable insights that drive decisions and improvements. If you’re tired of playing catch-up with your data, it’s time to give Monte Carlo a try. Enter your email below to learn more.
Our promise: we will show you the product.
Frequently Asked Questions
What is a data quality dashboard?
A data quality dashboard is a visual tool that provides an overview of key metrics related to the quality of your data. It helps monitor aspects like accuracy, completeness, consistency, timeliness, validity, and uniqueness of data.
What does a good data dashboard look like?
A good data dashboard is clear, easy to use, integrates data from various systems, aligns with company goals, and involves input from stakeholders. It should be designed to be user-friendly and deliver real-time insights.
What is the purpose of a data dashboard?
The purpose of a data dashboard is to ensure data is trustworthy and reliable. It enables better decision-making, boosts efficiency, builds trust across teams, and helps organizations comply with data regulations.
 Product demo.
  What is data observability?
  What is a data mesh--and how not to mesh it up
  The ULTIMATE Guide To Data Lineage
