You Have More Data Quality Issues Than You Think

Say it with me: your data will never be perfect.
Any team striving for completely accurate data will be sorely disappointed. Data testing, anomaly detection, and cataloging are important steps, but technology alone will not solve your data quality problem.
Like any entropic system, data breaks. And as we’ve learned building solutions to curb the causes and downstream impact of data issues, it happens more often than you think.
In fact, while most data teams know they have data quality issues, they vastly underestimate how many occur on a monthly, weekly and even daily basis.
The Monte Carlo data observability platform automatically monitors the 5 pillars of data health (freshness, volume, distribution, schema, and lineage) end-to-end. Our product data from working with many data teams across industries, company sizes, and tech stacks shows the number of annual data incidents the average organization will experience is about one incident for every 15 tables.
So even with robust testing and other approaches, why do so many data quality issues go under the radar, only to surface hours, days, or even weeks later by stakeholders? How did it get to this point and what can be done?
In this blog post, I’ll dive into 8 reasons for hidden data quality issues (or, the “silent majority” of data downtime) and best practices for improving detection and tracking.
- Hidden in plain sight quality issues
- Data drift
- Expectations drift
- Ownership drift
- Lack of visibility into incident triage
- Lack of KPIs and SLAs for data quality issues
- The removal of human checkpoints
- Scale of coverage for data quality issues
Hidden in plain sight quality issues

Many reasons (including most in this article) organizations underestimate the prevalence of data quality issues involve factors that obscure their visibility or perception. But there are also data quality issues that strut around boldly in plain sight with no one the wiser.
For example, field health issues are seen every day, yet are among the most difficult data quality issues to detect and identify.
It can be deceptively easy to test for field health, and there are open source and transformation tools that can help. If a field can never be null, that’s simple enough.
However, defining thresholds is really challenging. The reason is that thresholds in the middle of the range are often different than the edges. For example going from 40% null to 50% null is probably fine. However, going from 0% null to 0.5% null could indicate a catastrophic failure.
Another hidden in plain sight data quality issue is freshness (or timeliness as it’s described in the six data quality dimensions). Your data consumers have deadlines. They are delivering reports or executing a data dependent operation at a certain time.
In each pipeline, when a table is late there are a sequence of processes that can compound the issue. Your business stakeholders may be leveraging out-of-date data unaware. Another possibility is they are simply not executing what needs to be done because it’s difficult to differentiate between when truly no records have been generated or something is broken upstream.
If you’re asking if having the data run an hour late is something that should be considered a data quality issue, then it might be time to start considering developing data SLAs because the only way to know is to talk with your stakeholders.
Data drift

Data drift is when data changes gradually and consistently in a direction due to a data quality issue rather than a real underlying trend. This insidious creep of bad data poses tremendous problems for anyone running basic data quality reports or anomaly tests because those processes are designed to catch big shifts in data.
And how can you expect a downstream data analyst to detect a data quality issue when all they see is a number that is slightly higher or lower on each report?
Data drift is also especially challenging because downstream data analysts may see a number went slightly up or down but it won’t be flagrant enough for them to question.
Expectations drift

There is an old myth that you can boil a frog and they won’t jump out of the pot as long as you gradually increase the water temperature. Okra recipes aside, the same can be true with data teams.
As long as there have been dashboards, there have been broken dashboards and data engineers trying to fix them.
It has been standard operating procedure for so long that many organizations may not understand how much value a data engineer can add to an organization if they weren’t constantly firefighting data quality issues.
For data leaders that have taken a step back to assess how their team is spending their time, the results have been shocking.
We spoke to more than 150 data leaders prior to launching the company. We discovered the average team was spending more than 30% of their time firefighting data quality issues.
At the former company of our product developers, 4 of 6 annual OKRs focused on dealing with or improving data reliability in some way.
Ownership drift

A data warehouse or lake is an absolutely crucial component of the modern data stack. However while it does serve as a source of truth, it can also suffer from what we call, “the tragedy of the commons.”
A warehouse can become a junkyard relatively quickly when your entire data team has access to the warehouse but there aren’t standard controls or good data hygiene in place. On paper it seems easy enough to make sure each data asset has an owner, but reality doesn’t always measure up.
You would never see a microservice named after a person in software engineering, but it’s a very, very common practice for each engineer to have their own schema in the warehouse.
The challenge is that every team will have natural turnover. People come and they go. When there isn’t strong lineage or other processes in place to understand how different data sets impact dashboards or other assets downstream, you lose visibility into potential data quality issues or incidents.
Tagging tables that are covered by data SLAs as part of a data certification process is a great solution to avoid the “you’re using that table?!” problem.
Lack of visibility into incident triage
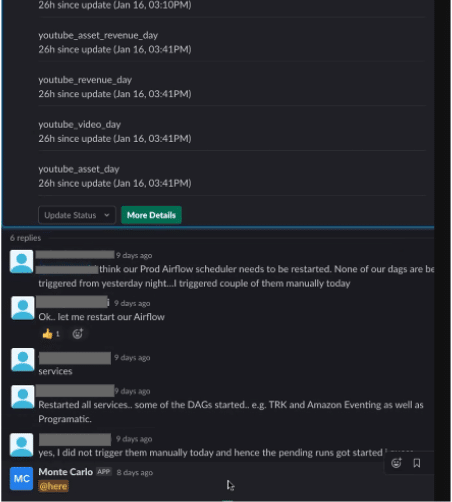
Speaking of visibility issues, a lack of visibility into the incident triage process is one of the biggest reasons I’ve seen for data leaders not only underestimating their number of data quality issues.
Data engineers don’t want to shout from the rooftops when there is broken data pipelines, inaccurate data, or inconsistent data. Unless there is a strong data incident triage process and culture in place–and it occurs in a place with persistent chat like PagerDuty, Microsoft Teams, or Slack–identifying and mitigating data quality issues happens behind the scenes in email.
Lack of KPIs and SLAs for data quality issues
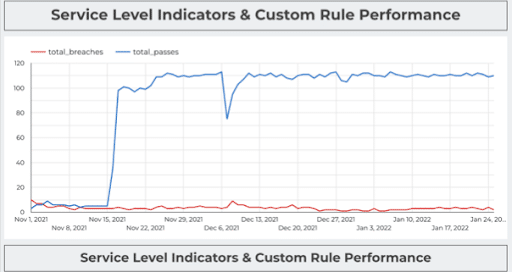
Ironically, one of the reasons data teams may not grasp the full number of data quality issues that occur is…a lack of data.
That is why more data teams have been starting to set data SLAs or service level agreements between the data team and the business specifying the level of performance they can expect from data systems. After all, you can only improve what you measure.
Senior Data Scientist Brandon Beidel did exactly that for Red Ventures. As Brandon said:
“The next layer is measuring performance. How well are the systems performing? If there are tons of issues, then maybe we aren’t building our system in an effective way. Or, it could tell us where to optimize our time and resources. Maybe 6 of our 7 warehouses are running smoothly, so let’s take a closer look at the one that isn’t….
With these data SLAs in place, I created a dashboard by business and by warehouse to understand what percentage of SLAs were being met on a daily basis.”
The removal of human checkpoints
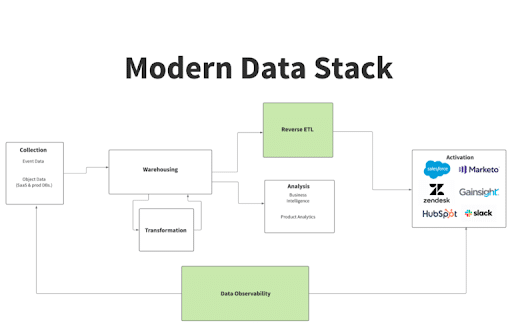
For the longest time (perhaps too long), data analysts and business stakeholders have been the safety net for an organization’s data reliability.
If bad data got piped to a dashboard hopefully someone on the data analytics team would notice that it “looks funny.” Modern data stacks are advancing to the point where more humans are being removed from the loop.
For example, many organizations are starting to implement reverse ETL pipelines that pull data from the data warehouse directly into an operating system (like Marketo or Salesforce). Or, perhaps the data is being used to inform a machine learning model.
These processes make data much more actionable and valuable, but they can also make it harder for data teams to spot data quality issues. Automated processes can benefit from automated data observability and monitoring.
Scale of coverage for data quality issues

The scale of coverage is consistently the top shock factor for organizations that see end-to-end data observability solutions in action for the first time. Automated discovery and machine learning fueled monitors are super powerful.
One of the most common refrains we hear related to data quality is, “I couldn’t have written a test for all of that.” And it’s true. Data ecosystems are simply growing too fast and there are too many unknown unknowns to manually write tests to cover everything.
What typically happens is data teams will write tests for things that have failed in the past. But for that to work you would need everything to have broken at least once and no new data assets to have been added in the intervening time.
Manual processes can’t scale and the result is common data quality issues get missed and data integrity pays the price.
How to fix data quality issues with data observability
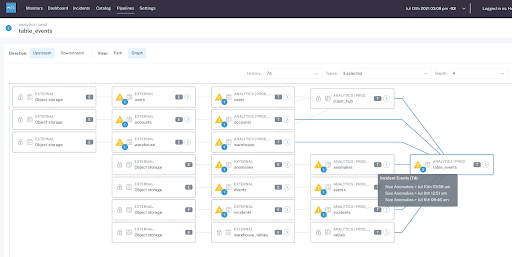
Instead of asking yourself how to mitigate data quality issues manually, it may be time for a more automated, scaled approach.
Data observability solutions connect to your existing stack without having to modify pipelines or write new code.
With proactive monitoring and alerting in place, the time to detection for data issues is drastically reduced. Issues that might take a team hours, days, or even weeks(!) to notice are caught and sent to teams in Slack (or other communication tool) within minutes.
Shortening the time to detection also naturally shortens the time to resolution as it’s a quicker cognitive jump to understand what has changed in the environment.
Data observability also shortens time to resolution with end-to-end lineage, which monitors data assets and pipelines along the entire data lifecycle. This pinpoints where the breakage has occurred and greatly accelerates root cause analysis.
If you’re still on the fence, I highly encourage you to continue to evolve your data quality best practices and metrics. Track your number of data incidents, time to detection, and time to resolution. Then come talk to us and see if you’re truly capturing the full extent of your data quality issues.
If you want to know more about how to measure data downtime or other data quality metrics, reach out to Francisco and book a time to speak with us in the form below.
Our promise: we will show you the product.
 Product demo.
  What is data observability?
  What is a data mesh--and how not to mesh it up
  The ULTIMATE Guide To Data Lineage


