Find and Solve Databricks Data Quality Issues with Monte Carlo
As the use of data has expanded to include using data to proactively make decisions and pair with AI and machine learning workloads, the popularity of Databricks has also risen.
Databricks was founded by the creators of Apache Spark, which remains an open source coding framework created to support big data processes including ETL and analysis. As you can imagine with that background, Databricks is often the tool of choice for many companies that not only use Spark, but also desire more flexible storage and corresponding workloads for their data initiatives.
As part of our goal to support the most popular centralized data stores, we announced our support for Databricks a few months ago, which included support for finding Databricks data quality issues ranging from:
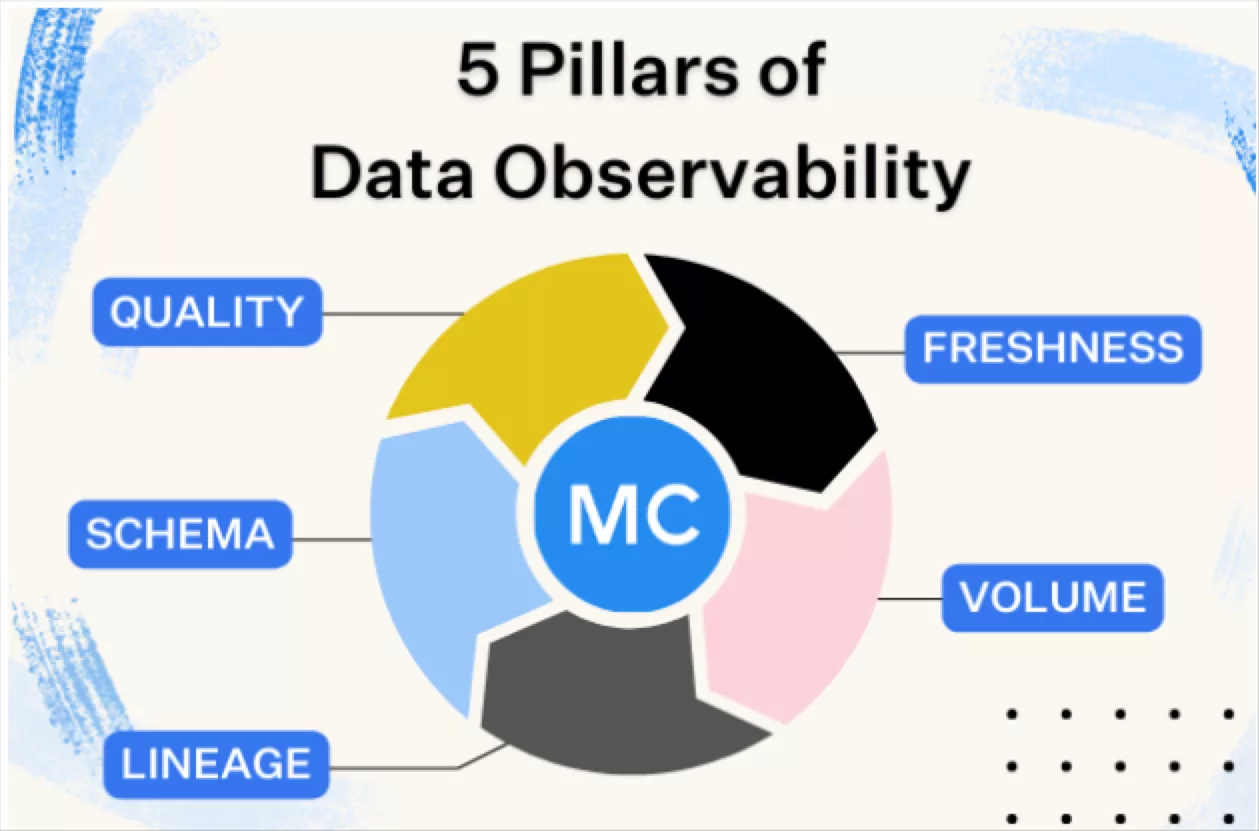
- Freshness – Was my data, either from ingestion or transformations, updated as expected?
- Volume – Did we see the expected amount of bytes changed?
- Quality – Are my values within the expected range(s)? Are they unique if they were expected to be? Was there any issue that inserted null values?
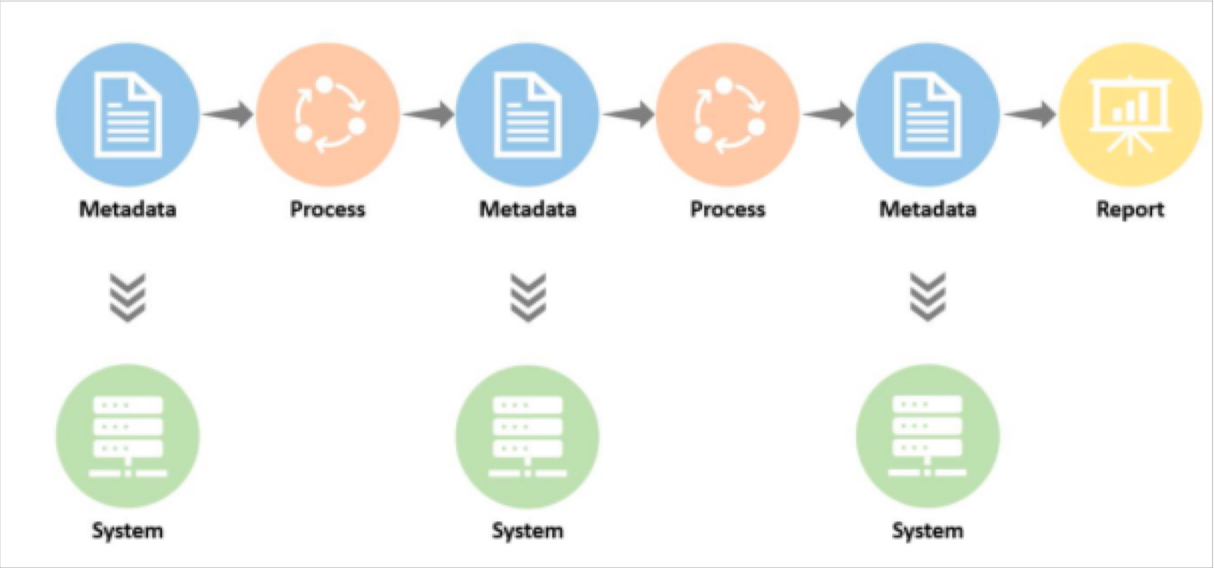
Building upon that release, and bringing our support for Databricks closer to parity with other long supported destinations such as Snowflake, BigQuery, and Redshift, was the announcement of support for lineage graphs for Databricks via Unity Catalog.
By leveraging Databricks’ native Unity Catalog tool, we’re able to understand the referential relationships between objects in customers’ Databricks environments, to recreate that mapping in our UI, while overlaying where incidents exist.
This way, users can massively reduce the amount of time they need to troubleshoot incidents by avoiding the traditional method of manually parsing through upstream queries that feed into a table with an incident. Instead, they can visually scan for associated incidents and objects to find the origin of issues.

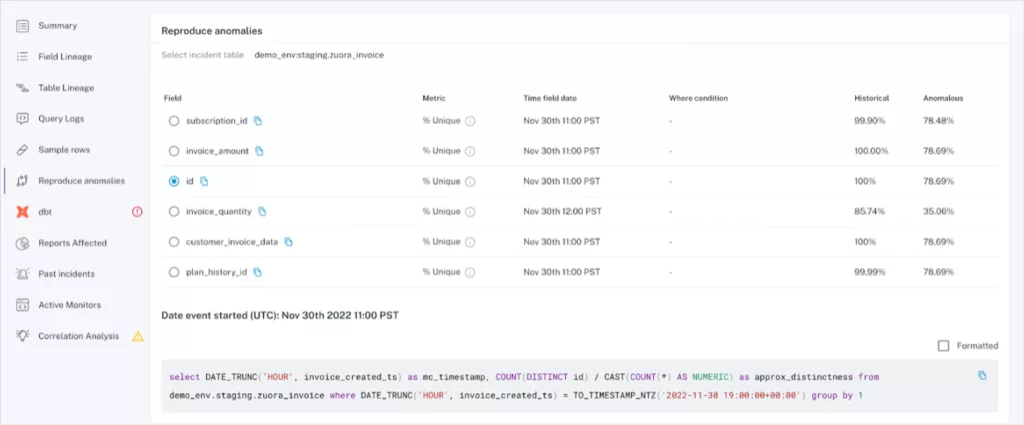
Continuing in the vein of Databricks data quality, we now offer the ability to sample impacted rows of an incident and reproduce the issue yourself through a query that we generate and display in the UI.
Let’s walk through an example.
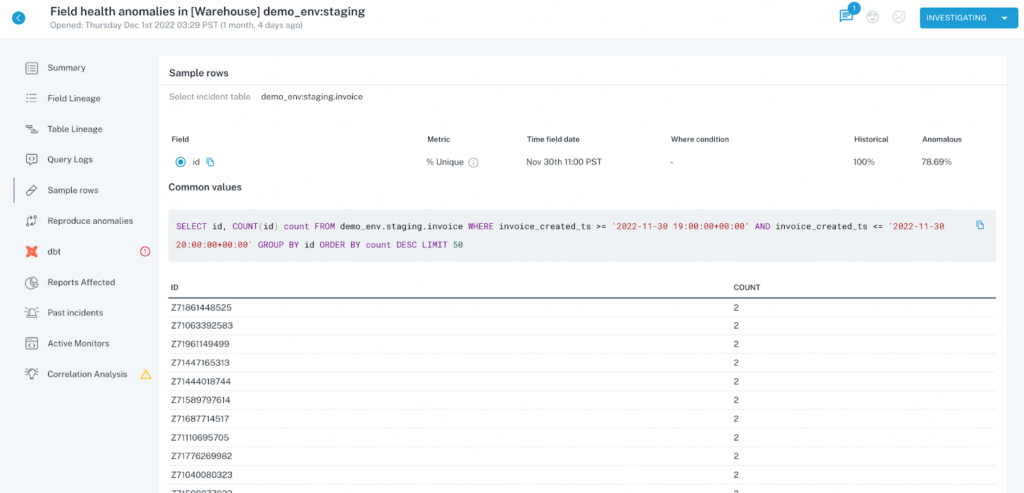
- For the field “id”, we should expect to see that every value is unique, as each value is randomly generated, and needs to remain unique so that we can accurately use it as a key for joins.
- With the Sample Rows functionality, we can immediately see in the UI which IDs have a count of more than 1, so that we can use our understanding to form hypotheses on how the bad data was created in the first place.
- Using the “Reproduce anomalies” tab on the left hand side, we also generate a query that you can use to calculate the data quality metric – in this case, we highlight how we calculated the percent of unique values associated with the “id” field.
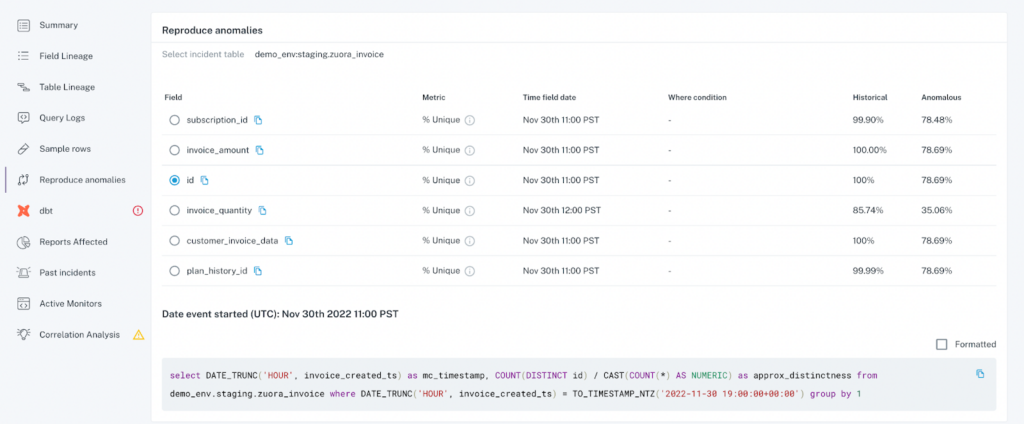
- In this example, by using the “Sample Row” function in step 2 to understand which IDs were related to duplicates, along with using the query generated in step 3 to get a larger sample size and perform some manual validation, we were able to understand that all IDs starting with “Z”, that we know were created in the past 2 days, were the symptoms of the issue, and can now focus our troubleshooting efforts solely on code changes from the past 2 days, rather than spend that time evaluating a full list of changes.
If you’re using Databricks, you’ve already made a commitment towards using data to fuel your business. With a data observability tool like Monte Carlo, you can ensure you’re improving your Databricks data quality to make the most of those investments, both in your data teams and the tools that you’re using.
Interested in solving Databricks data quality issues? Schedule a time with us using the form below to understand how data observability can help.
Our promise: we will show you the product.
 Product demo.
  What is data observability?
  What is a data mesh--and how not to mesh it up
  The ULTIMATE Guide To Data Lineage


