Product demo.
  3 Steps to AI-Ready Data
  What is a data mesh--and how not to mesh it up
  The ULTIMATE Guide To Data Lineage
 How Roche Built Trust in the Data Mesh with Data Observability

Since Zhamak Deghani introduced the concept of the data mesh in 2019, this decentralized approach to data architecture has generated an enormous amount of buzz. But what does it actually look like to implement a data mesh at scale?
The data team at Roche has the answer.
Headquartered in Switzerland, Roche is a leading, global pharmaceutical and diagnostics company creating and leveraging massive amounts of organizational data. With a broadly distributed team and endlessly expanding use-cases, the data team at Roche was quick to recognize the potential of the data mesh for large organizations—but implementing one was no small order.
Now, more than three years into their journey, the Roche team has emerged enlightened—and ready to reveal their learnings.
At a recent event, Harvey Robson, Global Product Owner of Data Quality and Observability, Global Data Engineer Roberto Münger, Data Architect Santosh Sivan, and Data Engineer Hendrik Serruys, shared their experience with the data mesh architecture. From starting small to implementing data observability for reliability, read on to discover key learnings from the team—and what you’ll need to build a data mesh of your own.
Table of Contents
The challenge: Laying the foundation for a scalable data mesh
The journey to a data mesh began as a top-down initiative at Roche. Late in 2020, its corporate executive committee launched their own Roche Data Insights (RDI) program — what Santosh describes as “a playbook of how you do data mesh.” They laid out the platform, the tools, and the frameworks necessary for domains to onboard into the data mesh journey and develop data products.
A quick recap on the data mesh: unlike traditional data infrastructures that centralize ingestion, storage, transformation, and output of data in a monolithic platform, a data mesh supports distributed, domain-specific data consumers. This architecture prioritizes a self-serve data platform and treats data as a product, and usually requires each domain to own and manage their own data pipelines. The data mesh is a concept and framework, not a singular piece of technology — which means implementing it requires buy-in and participation across the organization.
So at Roche, even with a clear mission and executive sponsorship, fostering the adoption of a data mesh took real work. The organization started with a few mature domains — their go-to-market and manufacturing business units — to initially onboard the data mesh.
“We were doing a lot of mindset changes from the traditional way of operating,” said Data Architect Santosh Sivan, whose role involves acting as an internal data mesh consultant to help different domains adopt the framework. “It is a socio-technical change, so we had to get a lot of people into training on how to do product management with data. It was a tough initial journey.”
But over the next few years, one domain at a time, Roche was able to scale the data mesh — and now has 30 domains with at least 300 data products delivering business impact.
One outcome of the data mesh, and the company’s larger migration to a modern, cloud-based data stack, is that consumers can now shop for and discover data products in the self-serve Roche Data Marketplace, which Santosh describes as their internal Amazon for data.
But, Roche data leaders knew that if they wanted consumers to successfully discover and access the data on their own, they would need to start measuring and communicating the quality of that data as well—and that’s when data observability became critical to their solution.
The solution: managing trust with data observability
As the Roche team expanded the data mesh, they focused on three areas: maintaining the value and impact of data, marketing data products to increase adoption, and building trust.
“If there’s no trust, the platform will fall,” said Santosh. “That’s the key for making sure we can increase the usage of data products.”
The data team chose to layer Monte Carlo’s data observability platform across their data stack. That includes automated anomaly detection and triage, as well as end-to-end lineage to better understand the intertwined relationships between upstream sources, complex pipelines, and downstream data products.
Data Engineer Hendrik Serryus shared an example of how Monte Carlo functions at Roche from this past June, when he received an automated alert in his inbox from Monte Carlo, notifying him that more than 50% of his team’s source tables had shown a significant increase in volume over the last 24 hours. Literally millions of rows were being dumped into the Snowflake warehouse, where only hundreds or a few thousand were expected.
“Thanks to that very early warning, we were able to come together, analyze the problem, figure out the solution, execute upon it, and clean up our environments — all between Thursday and Friday,” said Hendrik. “On Friday, not a single data product downstream had been impacted, and no one on the business side had even realized that anything had gone wrong in the first place. You can wonder if that’s a good thing or a bad thing, but that’s what the life of a data engineer is all about.”
Given the scale of Roche’s data products, Hendrik says his team deals with these kinds of instances on a weekly basis. “Data observability has really shown its value for us — on one hand, scaling our products while on the other, keeping them healthy and keeping oversight.”
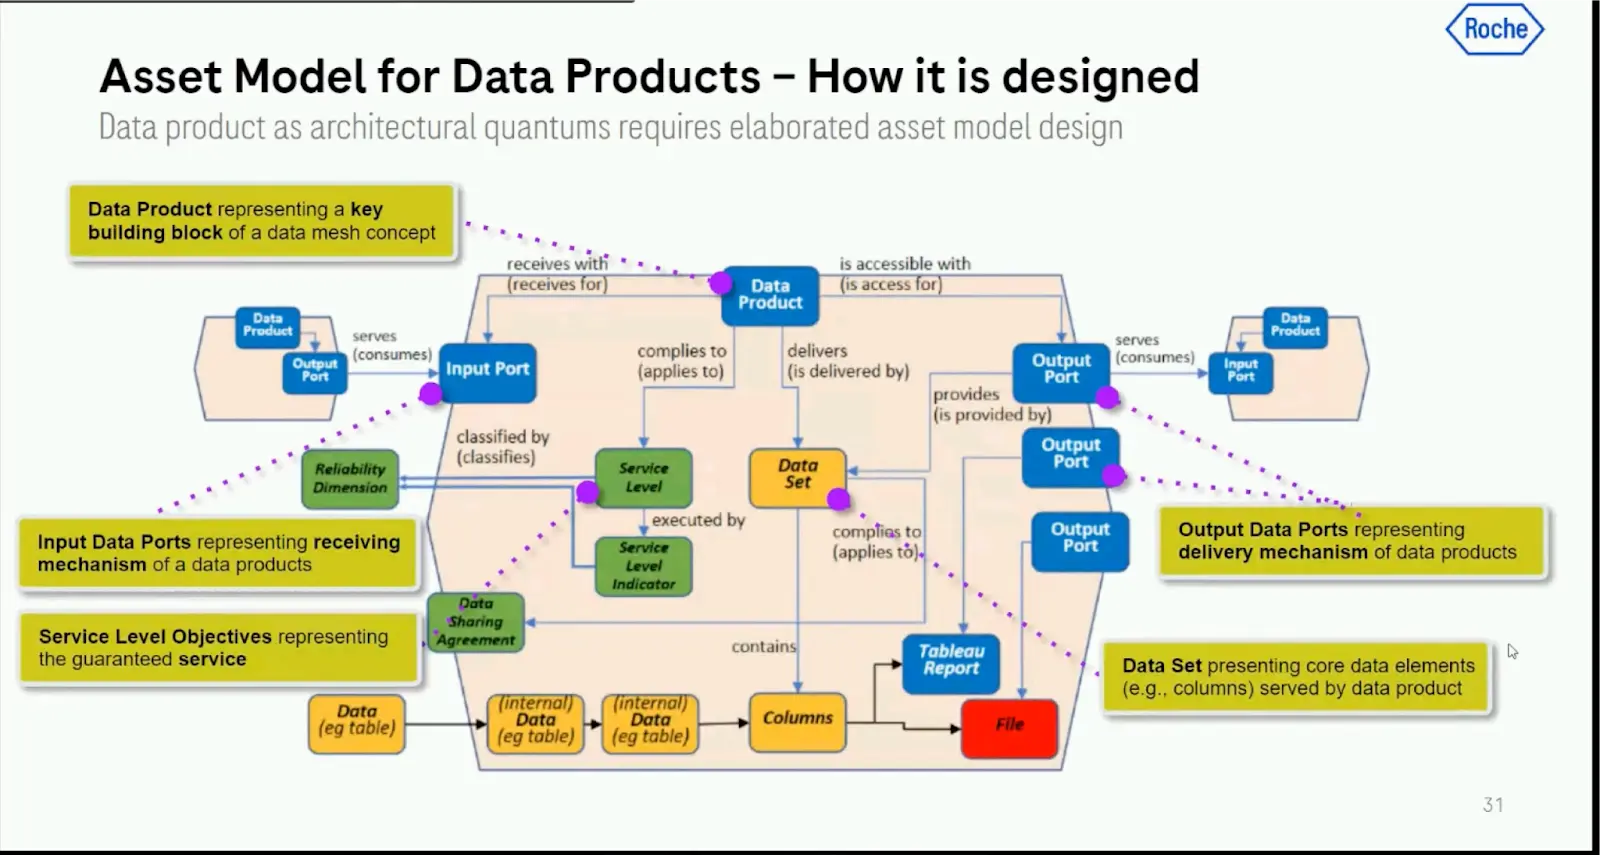
Roche is proactive about monitoring quality and has developed an organization-wide system for measuring data reliability. Each data product has multiple service level objectives (SLOs), which are measured by service level indicators (SLIs). In turn, each SLI is associated with one of five reliability dimensions — availability, performance, completeness, consistency, and freshness — and the trustworthiness score is calculated as the average of all the individual scores of the previous level.

These metrics are published within the Roche Data Marketplace, putting reliability front and center and building trust with consumers through greater transparency.
Data observability use cases in the manufacturing domain
To illustrate how data observability builds organizational trust and supports the data mesh, Hendrik and his colleague Roberto Münger shared specific use cases from their manufacturing domain.
This segment of the organization is responsible for producing an enormous breadth of equipment used in hospitals and laboratories, from big machines to tiny sensors and cartridges. More to the point, the manufacturing domain produces an extraordinary amount of data—including six globally distributed data teams and roughly 30 developers managing more than 3,000 tables in production and nearly 100 data products.
“We’re the fastest and the biggest domain within Roche today, and we’re proud of that,” said Hendrik. “That also means we deal with issues before everyone else, which is less fun. With a ratio of one developer to 100 tables in production, you can see why data observability is really growing in importance for us as we keep our data up and running while scaling.”
Use case: discovering data products in the data mesh
Roberto described the value of Monte Carlo’s automated lineage in their workflow, especially around addressing one of the primary issues of decentralized data modeling: duplication.
Monte Carlo’s data lineage provides a clear view of how upstream sources, including production tables and Tableau reports, populate data products. When faced with requests for new data products from known sources, the team uses lineage to check if those sources are already in use by an existing data product — avoiding unnecessary or duplicative products. It also helps the team spot opportunities to collaborate on data products across domains, improving overall efficiency.

Use case: improving performance
Robert and his team also use Monte Carlo’s Performance dashboard to review the performance of their queries.
“This helps you pinpoint any bottlenecks in your pipeline and streamline the effort to reduce technical debt where it’s needed most,” said Roberto. “This helps you maintain a high performance of your pipeline, quickly address emerging issues, and reduce cost consumption.”
In one instance, Roberto shared, the performance dashboard helped his team identify a pattern between the least efficient queries and design a solution to optimize their performance. As a result, they saw a 20% reduction in Snowflake credit costs and improved performance for their data pipelines — even as they continued to steadily increase the number of pipelines in their system each day.

Use case: monitoring data products
Since a data mesh puts the burden of ownership on domains, having clear visibility into the health of data products is a must. Roberto described how he and his team in the manufacturing domain use Monte Carlo’s Data Product dashboards to isolate data quality metrics for a single data product.
In the dashboard, he can see all observability dimensions, the tables or datasets inside the data product, and every table that feeds that data product. If any upstream alerts are triggered, they’ll be visible to the downstream data product owner.
“As a data steward, I can quickly see where alerts are, I can see who the data steward is behind the other product or tables, and I can kindly and politely ask them to go and address their issues,” Roberto said.
With more visibility into the entire upstream pipeline, data product owners and data stewards can take action when issues arise.
“In a single glimpse, I’m empowered to monitor a dozen tables,” says Roberto. “That honestly really helps us to grow our products and keep oversight at the same time.”

The outcome: increased data trust and data product usage
By providing end-to-end visibility across their data stack and distributed data products, Monte Carlo is helping Roche build trust and increase adoption. With data observability powering their data’s reliability, Roche consumers can easily self-serve their data and make critical decisions with confidence.
The modularity of Monte Carlo has been key to Roche’s approach to the data mesh. In the same way their distributed architecture scaled incrementally by domain, data observability could be easily scaled over time.
Looking forward, the team plans to continue using Monte Carlo’s lineage to discover gaps and identify new opportunities within their data products. They also plan to continue refining their ownership strategy to better surface insights to their domain teams and avoid alert fatigue when something goes wrong.
“We’re starting to see cross-domain collaboration, reduction of redundancies in data products, and efficiency built into the system because not everyone is now building their own data products or reports,” said Santosh. “We’re starting to see a lot of cost savings. The data mesh is the right thing for us to do at this point in time. And our partners at Monte Carlo are helping us build trust.”
Our promise: we will show you the product.
Read more posts.