How Swimply Built Its Hyper Growth Data Stack with Snowflake, Fivetran, and Monte Carlo

Delivering timely insights across the organization is crucial for any data team. But for a seed-stage marketplace with a highly seasonal business model, speed-to-insight is sink or swim.
Quite literally, in Swimply’s case. The Los Angeles-based startup is a marketplace that connects people to spaces; predominantly focused on pools and recreational areas like pickleball, tennis, and basketball but steadily expanding to new verticals as well.
So when Michael Shledon joined the organization as Head of Data in 2022, he was ready to roll up his sleeves and get to work building a data stack suited for a dual-sided, data-driven, hyper-growth marketplace. We sat down and spoke with Michael about his data journey just a week after his one-year anniversary with Swimply. He shared the ins and outs of his selection criteria, his must-have tools, and his hard-won wisdom for other data leaders looking to build a modern data stack from the ground up.
So let’s dive in.
The data landscape at Swimply
Michael’s background was perfect for what Swimply needed. He joined the startup after spending two years on Community at Meta, and before that, six years on Uber’s Marketplace team—where he had come on board as a data science intern in 2014, back when the data team was fewer than 15 people. So Michael knew what it looked like to grow a high-quality, high-impact data team, and joined Swimply to build their data team and stack from the ground up.
“Marketplaces are really interesting for data scientists,” said Michael. “And the founders had an early commitment, despite not having a lot of data to work off when I first joined, to make this a really data-driven company. And I know that’s a buzzword used indiscriminately across the industry now, but they really meant it.”
The founders invested in a small-but-mighty data team of three (Michael himself, a data scientist, and a data engineer) to serve the rest of the organization, around 45 people at the time of our conversation. “They wanted every team to not only be able to monitor and track their impact and their data, but to develop their strategies based off data and identify their areas of opportunity off of data,” said Michael.
Given their relative size, Michael’s data team members aren’t embedded into specific business units, but support the entire company. The data team leads core strategy and analysis across the company; from core product developments to supply operations initiatives to supporting top of funnel growth, there isn’t a stone left unturned by the team.Their daily work is prioritized based on potential value and opportunity.
“One day it might be search,” said Michael, “The next day it might be working with the growth team on attribution, and the day after that it might be understanding which pools are the most high-value for the inventory and then working with the supply team to acquire those pools. It’s a mix of everything, and people here are really expected to be self-sufficient, proactive, and find areas of opportunity with the business stakeholders.”
If this sounds like a tall order for a team of three, you’re absolutely right. That’s why building the perfect data stack was absolutely essential.
The challenge: creating a single, stable source of truth
When Michael joined the company, the engineering team had a preliminary data stack, using Stitch and Redshift, in place. And while those tools were getting the basic job done, Michael knew they needed more. The data stack of his dreams needed to centralize all the data across the organization, while leaving his team’s hours available to surface insights and partner with the business.
“Because we had this mandate as a data team to support the entire company, we needed a data stack that could solve two central issues,” Michael said. “One, to centralize all of the data from all of the different parts of the company in one stable place that everyone could use and refer to as a source of truth. And two, to enable us to have enough time to really focus on the insights and not just the data infrastructure itself.”
Michael knew that as a seed-stage startup, his team would need to stay small and lean. That meant a low-maintenance data stack—which, as any data leader will tell you, is no small feat.
“We can’t be spending a lot of time maintaining the stack if we’re trying to get value from the stack itself,” Michael said. “So each and every tool here was picked with that in mind.”
The solution: a centralized data platform
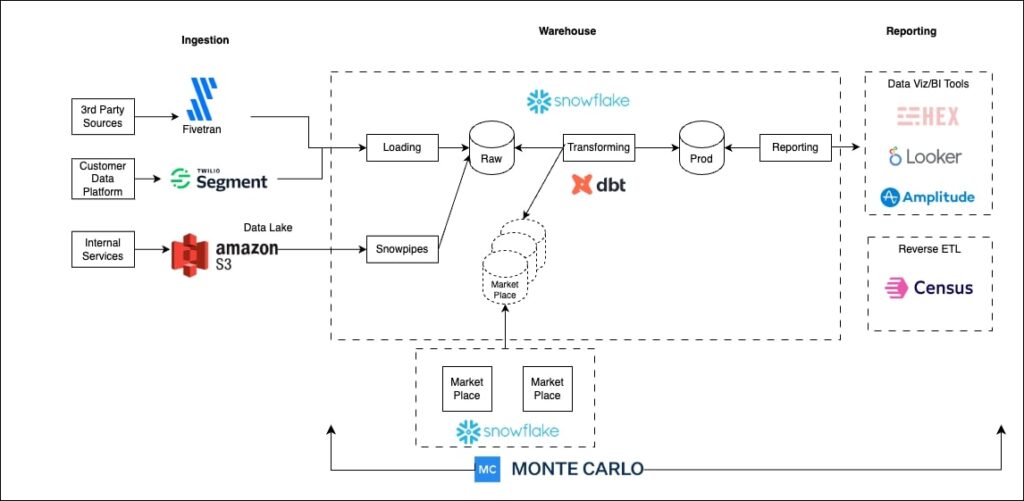
Michael settled on a few core tools that would work well together, be easy to implement, and wouldn’t require a lot of ongoing maintenance: Snowflake, Fivetran, and Monte Carlo.
“I think the great thing about Snowflake is how it can natively handle a lot of different types of data,” Michael said. This was crucial, as Swimply maintains traditional and geographical datasets, with data piping in from APIs in a JSON format—but Michael didn’t want his team to spend a lot of time customizing workflows.
“Snowflake being able to natively handle all of that within its workflows, and having very easy tools and functions to leverage that, has been really helpful,” Michael said. “And the marketplace in Snowflake has been really, really helpful for getting up and running very quick third-party integrations within a day.”
Getting that data into Snowflake is made relatively easy with Fivetran. The tool handles a significant amount of formatting and establishing consistent tables across data sources for Michael’s team.
“Fivetran in particular is a great tool for getting all of this third-party data from HubSpot, Zendesk, Google Ads, Facebook Ads—any third-party tool that we’ve ever touched—into our Snowflake database,” said Michael. “Using those tools early on was a little bit of a nightmare, to be honest with you. I remember looking at some HubSpot tables and they were a thousand columns long and totally unintuitive. Once we started using Fivetran, it basically solved all of that under the hood and made it something very easily usable so we could model it in dbt, develop tables and workflows in Snowflake, and visualize that in our tools like Looker.”
However, the data team ran into a roadblock. “What we ran into quite a lot was we were building this great data stack and getting to the point where we had all the centralized data, but then when we looked back to analyze a feature, the data was missing,” said Michael. “And it was really painful from a time cost, because not only do we have to go back and fix it—but we just lost three or four months of insights.”
Michael and his team needed to ensure that the data they were ingesting, transforming, and modeling was fresh, accurate, and complete. They chose Monte Carlo’s data observability platform to do just that.
“Monte Carlo has really stepped in to proactively identify and alert us to those gaps, and fix those right away,” said Michael. “So not only do we resolve issues quicker, but we save that opportunity cost of that loss of time.”
The outcome: delivering faster, trustworthy insights across the business
In the end, the Swimply data stack has achieved all of Michael’s goals. All the company’s data was centralized in a single source of truth, and trusted by the organization. Michael and his team can spend their valuable time partnering with growth teams, supply teams, and customer support teams to identify areas of opportunity and develop strategies.
“We got this whole stack up and running in maybe one to two months,” said Michael. “And what it enabled us to do is right away, especially during our peak season, leverage that data for insights. The speed of being able to get up and running, and know that the quality is there, really enabled us to move extremely quickly—at a time and place where we really needed to do so.”
What to know if you’re building your own data stack
For other data leaders looking to build a stack, Michael advises looking at your own company’s needs and growth stage. There is no one-size-fits-all approach to data stacks or data teams. But keep total cost in mind when choosing tools—especially headcount and how team members are spending their hours.
“I think time savings is the thing that really gets missed when picking the data stack,” said Michael. “The tools here, with some exceptions, aren’t necessarily the cheapest tools you can get…but the time savings, for us, was immense. It saved us literally maybe one or two additional hires by investing in this stack in terms of the setup and maintenance.”
Additionally, if your company is in a growth mode, find a stack that will start delivering insights—and value—fast.
“In terms of speed of development and speed to insights, we were able to get these in front of the company three to six months earlier than we could with any other stack,” said Michael. “There’s a lot of headwinds in the current market, and you still have to show a lot of growth early on to survive as a startup. So that was invaluable to us.”
What’s next for data at Swimply
Now that their modern data stack is in place, Swimply’s seasonal business model means Michael and his team are focused on one thing: summer.
“You live and die by the peak seasons here,” said Michael. “It’s all about deriving the insights from our great data stack and leading us to the best strategy to approach supply and demand this summer. How do we clear the market? How do we get our match rate and efficiency up there?”
With each iteration, Swimply continues to expand verticals, countries, and use-cases. And the more the expansion, the more and fundamentally different kinds of data will be coming down the pipes each and every day.
But Michael and his team are ready.
“As a startup, we’re always looking forward to the next race,” said Michael. “We’re always in survival mode. And so it’s really critical that our data stack enables us to focus on driving the business forward.”
Ready to build a data stack that will power your organization’s growth? Learn how Monte Carlo and data observability can ensure your insights are timely and trusted.
 Product demo.
  3 Steps to AI-Ready Data
  What is a data mesh--and how not to mesh it up
  The ULTIMATE Guide To Data Lineage


