How to Extract Snowflake Data Observability Metrics Using SQL in 5 Steps

Your team just migrated to Snowflake. Your CTO is all in on this “modern data stack,” or as she calls it: “The Enterprise Data Discovery.” But as any data engineer will tell you, not even the best tools will save you from broken pipelines.
In fact, you’ve probably been on the receiving end of schema changes gone bad, duplicate tables, and one-too-many null values on more occasions than you wish to remember.
The good news? When it comes to managing data quality in your Snowflake environment, there are few steps data teams can take to understand the health of your data from ingest to consumption.
Here’s a five-step approach for extracting Snowflake data observability metrics, and in turn, getting one step closer to trusting your data:
- Snowflake Data Observability Metrics Step 1: Map Your Inventory
- Snowflake Data Observability Metrics Step 2: Monitor For Data Freshness and Volume
- Snowflake Data Observability Metrics Step 3: Build Your Query History
- Snowflake Data Observability Metrics Step 4: Check the Health of Your Most Important Data
- Snowflake Data Observability Metrics Step 5: Consider Automation
Snowflake Data Observability Metrics Step 1: Map Your Inventory
For the purpose of this tutorial, let’s assume you have a single database on Snowflake called ANALYTICS (although, as with most data stacks, this is rarely the case). To run the queries below in your environment, simply replace ANALYTICS with the name of the database you are looking to track. To list the databases in your account, you can run “SHOW DATABASES”.
Your first step will be to map all the tables you have in your warehouse so you know what needs to be tracked in the first place. While you do so, mapping schema can be a powerful tool in understanding what’s in each table, and how that changes over time.
Here’s how to do that with Snowflake:
This query will fetch a list of all tables along with helpful metadata about their settings. The comment property is particularly useful if you’ve been diligent about documenting your data with COMMENT.
To get the schema for your tables – understanding how it evolves can really help prevent and troubleshoot data breakages – you might use this query:
Please note that the snippets above will help with tables, but we intentionally left out views and external tables. To pull metadata for those, we recommend using the following queries:
While it might add complexity to your implementation, these queries will fetch valuable information that is not available when querying information_schema.tables. For example, you will have the text property for views – which will provide insight about the underlying SQL query for your views.
Snowflake Data Observability Metrics Step 2: Monitor for Data Freshness and Volume
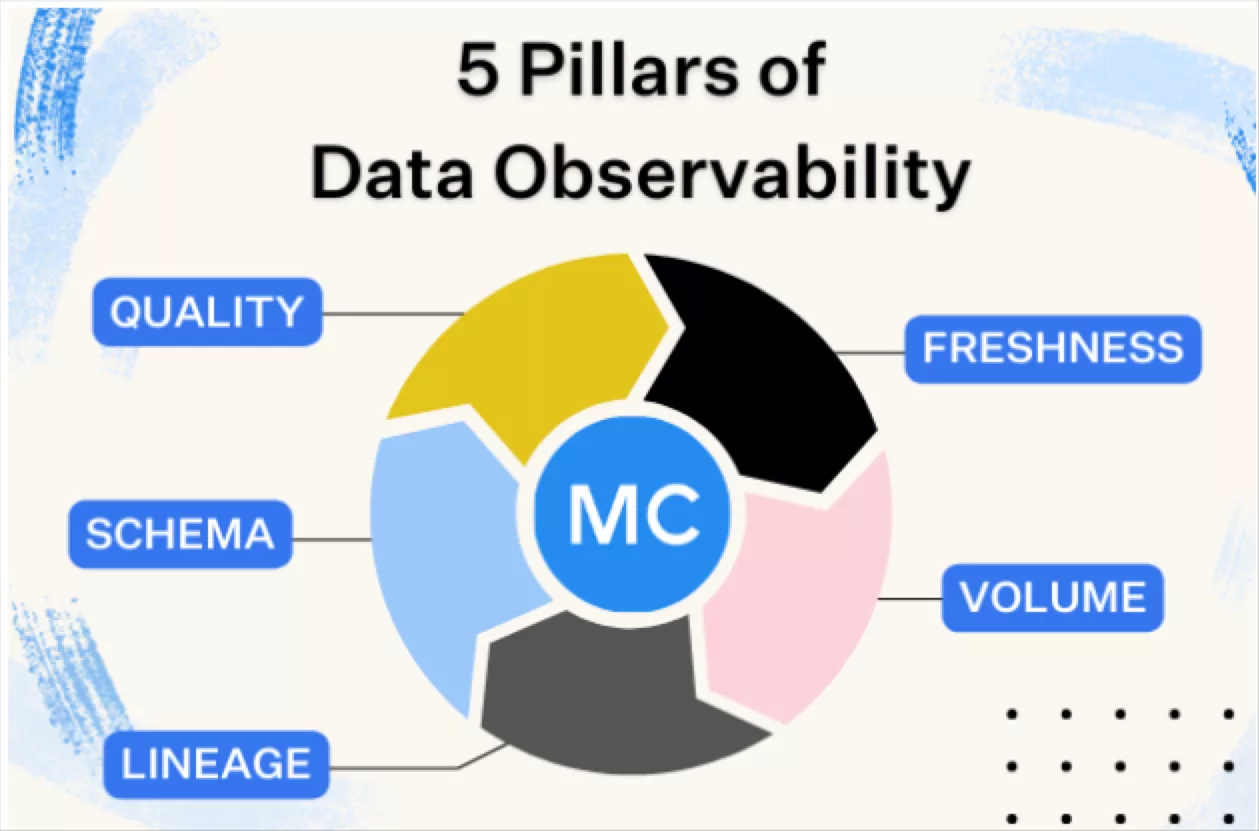
Tracking volume and freshness for your tables is incredibly important in understanding Snowflake data observability and the overall health of your data pipelines. Luckily, Snowflake tracks that information as writes are made to tables in the warehouse. You can pull how many bytes and rows tables have, as well as the time they were most recently updated using this query:
By storing these metrics and observing how they change over time, you can map how frequently tables get updated, how much data is to be expected in each update and most importantly – identify missing or anomalous updates.
Measuring the freshness and volume of views is not straightforward, as it is a function of the tables included in the underlying queries. As far as external tables go, we recommend using freshness information from “SHOW EXTERNAL TABLES…”.
Snowflake Data Observability Metrics Step 3: Build Your Query History
Having a solid history of all the queries running in your Snowflake environment is an invaluable tool when troubleshooting issues – it lets you see exactly how and when a table was most recently written to. More broadly, an analysis of your query logs can help map lineage (dependencies between tables), understand which users use which assets, and even optimize the performance and cost of your Snowflake instance.
This is the query we use to extract query logs – notice we’ll be filtering out system and faulty queries to reduce noise:
You might also find it valuable to take a look at the history of copy and load operations to understand how data is loaded and moved around:
Snowflake Data Observability Metrics Step 4: Check the Health of Your Most Important Data
Finally, for some of your critical tables, you might want to run data quality checks to make sure all fields are populated properly and have healthy values. By tracking health metrics over time and comparing them to past batches, you can find a range of data quality issues as soon as they appear in your data.
Here’s how you might do it:
In this example, we are collecting health metrics for two fields in our client_hub table. For the field account_id, a string, we track metrics like completeness (% of non-null values), distinctness (% of unique values) and UUID rate (% of records that match a UUID format). Tracking those over time would help identify common issues like accounts that have no IDs, duplicate records and IDs that have the wrong format.
For the numeric field num_of_users we track other kinds of metrics like Zero rate (% of records with the value 0), mean and quantiles. These metrics – when observed over time – can help us identify common issues like missing data causing our counts to 0 out, or bugs that would cause our user counts to be way off.
For scalability, note that we only track recent data (1 day in this example) and assume that past data was previously queried and stored. This practice – along with sampling if necessary – will let you track some sizable datasets efficiently and cost effectively.
Snowflake Data Observability Metrics Step 5: Consider Automation
When it comes to using this approach for Snowflake data observability in production, there are few considerations to keep in mind:
Scalability
Tracking a large number of tables and big datasets can become tricky. You’ll need to think about batching your calls, optimizing your queries for scale, deduplicating, normalizing the various schemas and storing all this information in a scalable store so you can make sense of it. This requires building a dedicated data pipeline that you operate, update, and maintain over time.
Pro-tip: don’t forget to keep track of your Snowflake credit consumption (you don’t want to be getting a call from your CFO…).
Covering other parts of your stack with data observability
Building truly reliable data pipelines and achieving Snowflake data observability requires more than collecting metrics. In fact, as the modern data stack evolves, it has become critical to keep tabs on the reliability of real-time streaming data, data lakes, dashboards, ML models, and other assets.
Making this Snowflake data observability approach scalable as your data stack grows to incorporate additional technologies and data sources, is a fundamental challenge. Since data can break literally anywhere in your pipeline, you will need a way to pull metrics and metadata from not just your warehouse, but other assets too.
Investing in solutions that allow these integrations to play nice with each other and your end-users, whether that’s your data engineers, analytics engineers, ML teams, or data scientists, should be a top priority. True data observability extends beyond the warehouse to provide insights into the health of data in your lakes, ETL, business intelligence dashboards, and beyond before broken data snowballs into bigger problems down the road.
Building workflows
The information you pull needs to be readily available to other members of the team, particularly when things break or you’re in the throes of conducting root cause analysis on your data pipelines. Baking in automatic notifications when issues are detected and a centralized (and easy-to-navigate) UI to better handle these workflows can spell the difference between fast resolution and days-long data disaster.
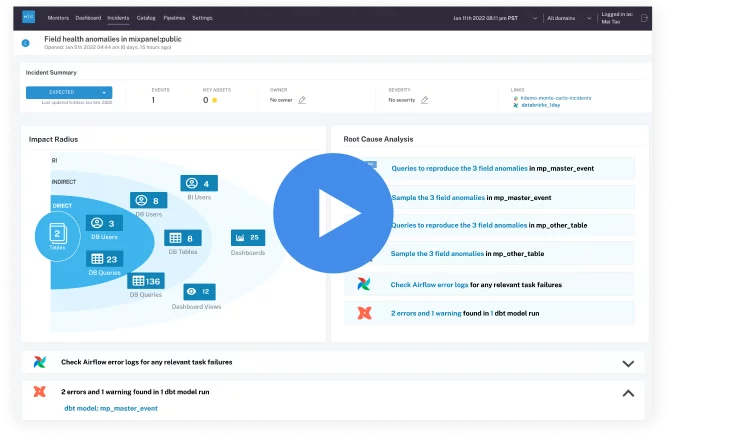
It’s no starship Enterprise (or Discovery, for that matter), but we hope this tutorial gives you the building blocks for data trust. If you are interested in automating Snowflake data observability and achieving coverage across your entire data stack, take a self-guided product tour or talk to us!
Now, go forth and SQL!
Interested in learning more? Reach out to Itay Bleier and the book a time to speak with us using the form below.
Our promise: we will show you the product.
 Product demo.
  What is data observability?
 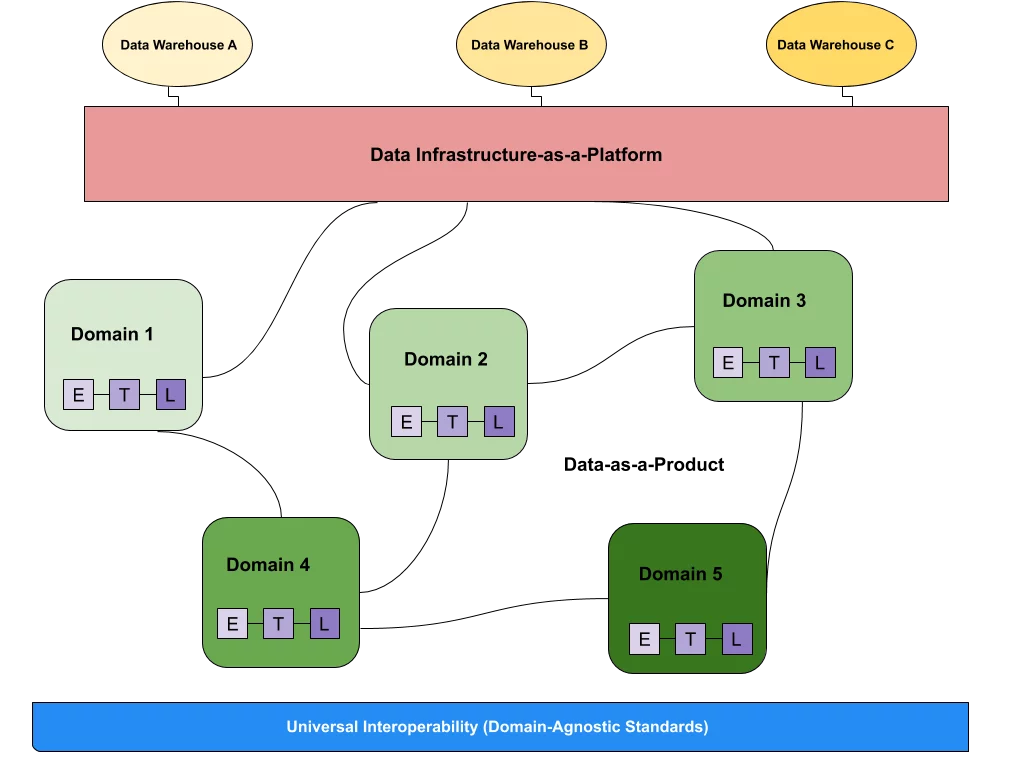 What is a data mesh--and how not to mesh it up
 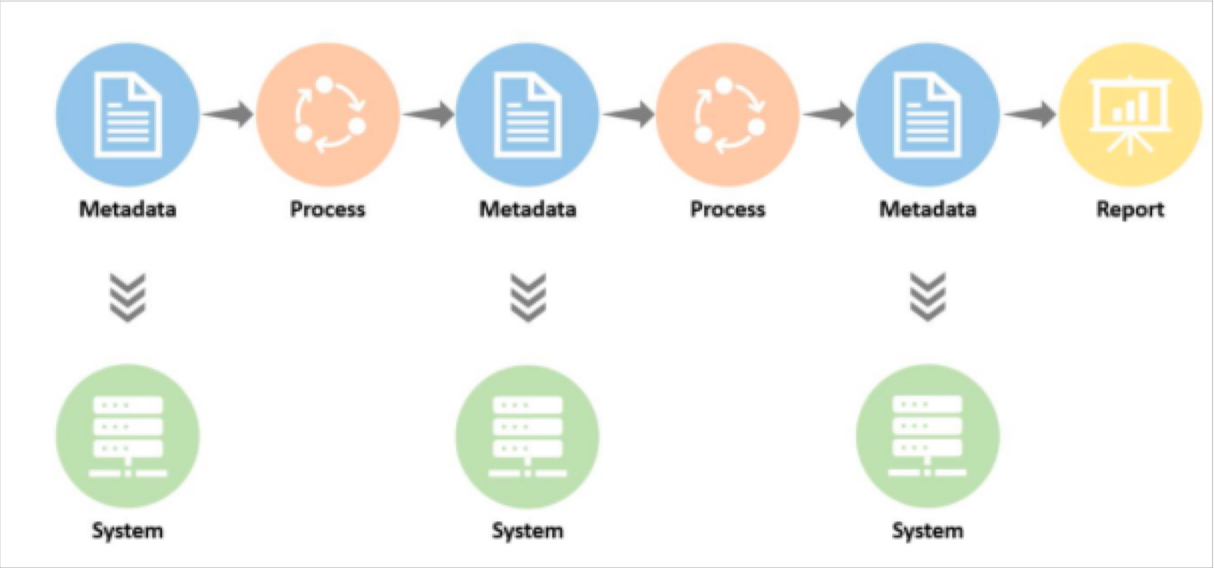 The ULTIMATE Guide To Data Lineage


