IMPACT 2024 Keynote Recap: Product Vision, Announcements, And More

After a couple of years recapping the excitement of the Snowflake and Databricks conference keynotes, it was beyond time to give the same treatment to the fourth annual IMPACT conference.
So let’s take a closer look at the keynote delivered by Monte Carlo co-founder and chief technology officer, Lior Gavish, as he took the virtual stage to share the “vision and mission driving Monte Carlo into 2025.”
Table of Contents
The Vision: Moving Beyond Data Quality
After the requisite, “here’s how much we have grown in the last year” introduction, we quickly dove into the heart of the theme of the keynote: Beyond Data Quality.
Viewers quickly found out those three words aren’t lip service, but intentionally provocative. Lior drove straight into the three reasons why data downtime happens:
And immediately called out that traditional data quality approaches don’t have insights into these root causes, and thus aren’t sufficient for ensuring reliable data delivery across modern data platforms.
“For us, data quality monitoring is just the first step, something we all must move beyond. As an industry we think a lot about the six dimensions of data quality, but at Monte Carlo we spend just as much time thinking about the three root causes of data downtime,” he said.
Lior then neatly tied the bow with feature highlights showing just how Monte Carlo provides visibility into the data, systems, and code in quick succession.
Now that everyone was grounded in the vision and in the platform, it was time to hear about the latest and greatest.
Expanding Data Quality Coverage with Powerful New Detection Features
I mentioned this in the Snowflake recap as well, but the constant release cycle of modern SaaS solutions doesn’t align with the once a year conference curtain drop schedule–and that’s a good thing!
And while new ground was broken (more on that later), Lior also spent time highlighting some of the most consequential new features introduced in the last few months. Because of Monte Carlo’s leadership position, these features are often not just new to the platform, but new across the entire data observability category.
Data Products
This simply named feature is incredibly powerful. Data Products enables data pros to simply select either the dashboard or most downstream table feeding their data product and automatically scale AI monitors across all the tables upstream (and new tables as they are created).
Bad data can infiltrate at any point in the data lifecycle, so this end-to-end monitoring helps ensure there are no coverage gaps and even accelerates incident resolution.
“Data and data pipelines are constantly evolving and so data quality monitoring must as well,” said Lior.
Data Profiling
Lior then highlighted how the Monte Carlo allows each member of the data team to play a role in reducing data downtime by introducing Data Profiler.
This new feature leverages data profiling and AI to make smart recommendations for specific data quality rules and anomaly detection monitors based on the historical patterns of your data.
This is a common workflow for data analysts and doesn’t require a single line of code.
Scaling Data Trust with New Dashboards and Reporting
I’ve talked to hundreds of data teams, and probably the most frequently mentioned term I hear relating to poor data quality is, “data trust.”
Data teams start with the benefit of the doubt, but every single data quality issue that makes it to the consumers or business stakeholders chips away at that trust.
Once your consumers stop trusting the data, they stop adopting it. The road from value driver to unnecessary overhead is paved with consumer facing data incidents.
On the flipside, if data teams can successfully communicate the reliability of their data products then they can foster greater adoption and develop more advanced use cases. The new and improved dashboards from Monte Carlo are designed with this purpose in mind.
Data Quality Dashboard
Lior showed off the new Data Quality Dashboard, which allows data teams to set SLAs and track quality on a use case by use case basis. Data teams can easily measure the data quality dimensions by data product, critical data element, team, data source, data contract, and more.
The dashboard provides a real time view of current quality, including detailed information about current issues, allowing data stewards to triage, prioritize and track problems in their domain. It also highlights quality trends, allowing governance managers and data stewards to measure the effectiveness of their data quality efforts.
Data Operations Dashboard
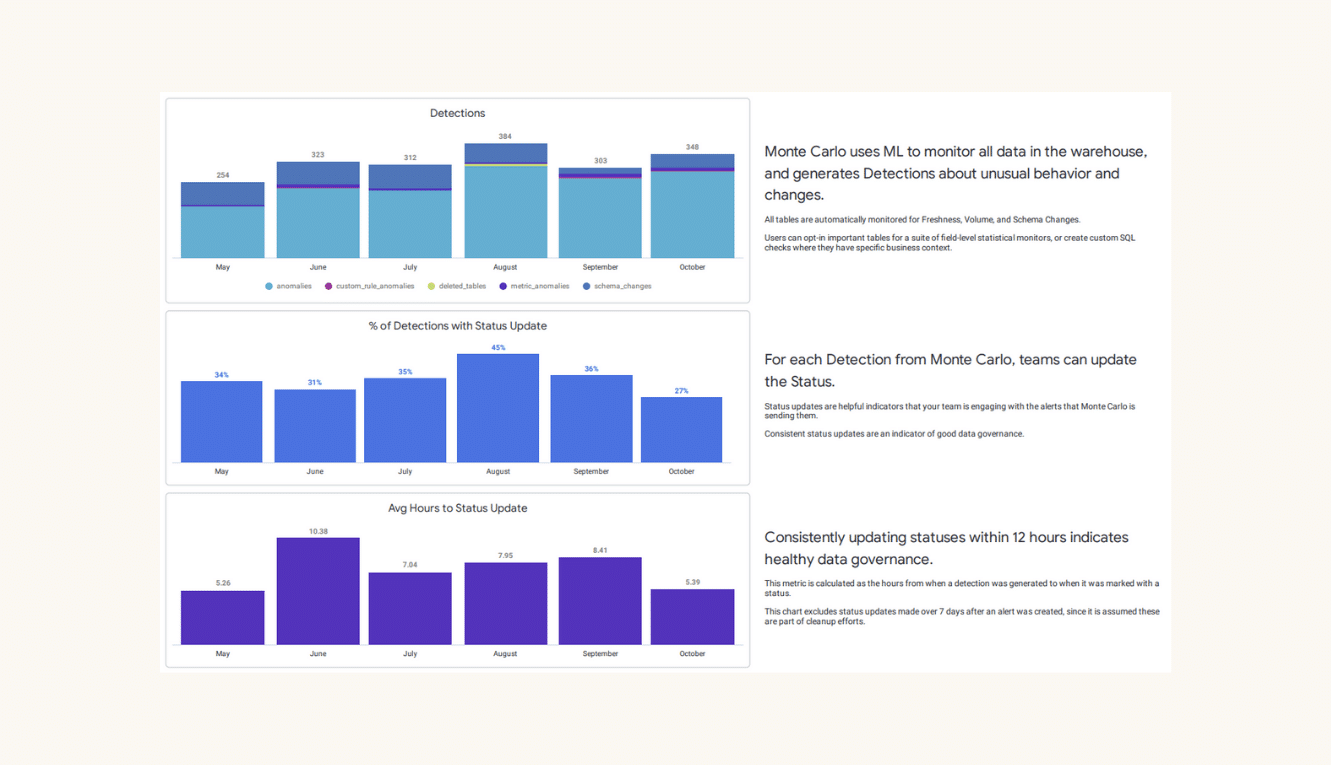
The Data Operations Dashboard is anything but just another data quality dashboard. No other data quality vendor goes beyond tracking the number of alerts/incidents to showcasing how different teams are responding to alerts and resolving incidents.
As Lior pointed out, it’s no coincidence that the data teams that are the best at tracking these incident management and operational performance metrics are also the ones that see the biggest jumps in their internal NPS data trust scores.
Enhancing Data Observability with Generative AI
Every tech conference keynote, even in a SaaS world, needs a card or two up its sleeve. Let’s dive right in.
GenAI Monitor Recommendations
Lior announced, for the first time, new Monte Carlo capabilities, powered by GenAI models, that will automatically recommend data quality monitors.
The way it works is that Monte Carlo feeds the LLM sample data, query log data, and other table metadata to build a deeper contextual understanding of the asset.
Following a table profile, the GenAI application detects patterns in the data that are otherwise difficult if not impossible to discover using more traditional methods, and then suggests monitors and rules to alert when there are anomalies in those patterns that may indicate poor data quality.
For example, a data analyst at a professional baseball team may use this new capability to quickly spin up data quality rules for a critical table labeled ‘pitch history,’ in which the GenAI will identify relationships between the column ‘pitch type,’ (fastball, curveball, etc.), and pitch speed.
Monte Carlo would then automatically recommend data quality rules that make sense based on the history of the relationship between those two columns, such as ‘fastball’ should have pitch speeds of greater than 80mph.
But there’s more: announcing our Microsoft Fabric Integration
Microsoft is one of the world’s largest providers of relational database solutions, many of which are central components within the modern data stack. Monte Carlo has robust support for many of these services today including Azure SQL, SQL Server, PowerBI, Azure Synapse and Azure Data Factory.
Lior concluded his keynote with a flourish, announcing full support for Microsoft Fabric, and welcoming Amir Netz, CTO of Microsoft Fabric and co-creator of PowerBI, to the virtual stage.
We’re excited to usher data quality and observability into the AI era with you – more to come!
All IMPACT sessions will be available on-demand, so be sure to catch any that you may have missed.
Our promise: we will show you the product.
 Product demo.
  What is data observability?
  What is a data mesh--and how not to mesh it up
  The ULTIMATE Guide To Data Lineage


