Product demo.
  3 Steps to AI-Ready Data
  What is a data mesh--and how not to mesh it up
  The ULTIMATE Guide To Data Lineage
 Interpreting the Gartner Data Observability Market Guide

From the first mention of “data observability” back in 2019 to today, data observability has evolved dramatically—from data stack nice-to-have to a “must-have” solution for enterprise companies.

According to Gartner, 50% of enterprise companies implementing distributed data architectures will have adopted data observability tools by 2026 – up from just ~20% in 2024.
With this level of enterprise demand, it’s not surprising Gartner has published its first Market Guide for Data Observability Tools.
So, what exactly is a Gartner Market Guide? And how should you leverage it as you evaluate different approaches to improving data quality and reliability?
Let’s get into it.
Table of Contents
What is A Gartner Market Guide?
According to Gartner:
“A Market Guide defines a market and explains what clients can expect it to do in the short term. With the focus on early, more chaotic markets, a Market Guide does not rate or position vendors within the market, but rather more commonly outlines attributes of representative vendors that are providing offerings in the market to give further insight into the market itself.”
We see the Gartner Market Guide for Data Observability Tools as a milestone that not only marks Gartner’s recognition of the category, but also how they’re defining it. It includes their perspective on how the market will evolve and the critical capabilities of representative vendors.
Now that we’ve established what the Gartner Market Guide is and what it means, let’s dive into the real meat of what it says.
The Gartner definition of data observability
While Monte Carlo is unquestionably the data observability category’s creator, we’re certainly not the only game in town – and that’s a good thing. A rise in competition always serves to validate a category’s value. The greater the competition—the more important the problem.
But with more vendors also comes more confusion.
According to Gartner:
“Vendors are offering a range of different capabilities branded as data observability, causing confusion in the market and tool adoption issues.”
The truth is, it’s often easier to tweak a definition than it is to develop more comprehensive features. That’s where tools like the Garnet Market Guide become important. Analyst reviews give leaders an objective third-party’s opinion on common features within a category—and forward to that, what’s really a differentiator.
Here’s how Gartner officially defines the category of data observability tools:
“Data observability tools are software applications that enable organizations to understand the state and health of their data, data pipelines, data landscapes, data infrastructures, and the financial operational cost of the data across distributed environments. This is accomplished by continuously monitoring, tracking, alerting, analyzing and troubleshooting data workflows to reduce problems and prevent data errors or system downtime.”
Our perspective:
Gartner does a good job covering what’s being monitored and the workflows associated with data observability tools. They also do a good job framing how data observability tools consider the end goal (reducing problems and preventing system downtime) in their workflows.
If we had to quibble, we might point out that data reliability is the primary focus and that financial operations are typically more of a secondary use case—but there’s so much good in this definition that it’s difficult to split hairs.
So, now that we know what data observability is, let’s look at what features and capabilities power this definition—again as defined by Gartner.
Critical features of data observability
As Gartner sees it, data observability has several critical features, each with the express goal of helping data teams “resolve and prevent” data quality issues:
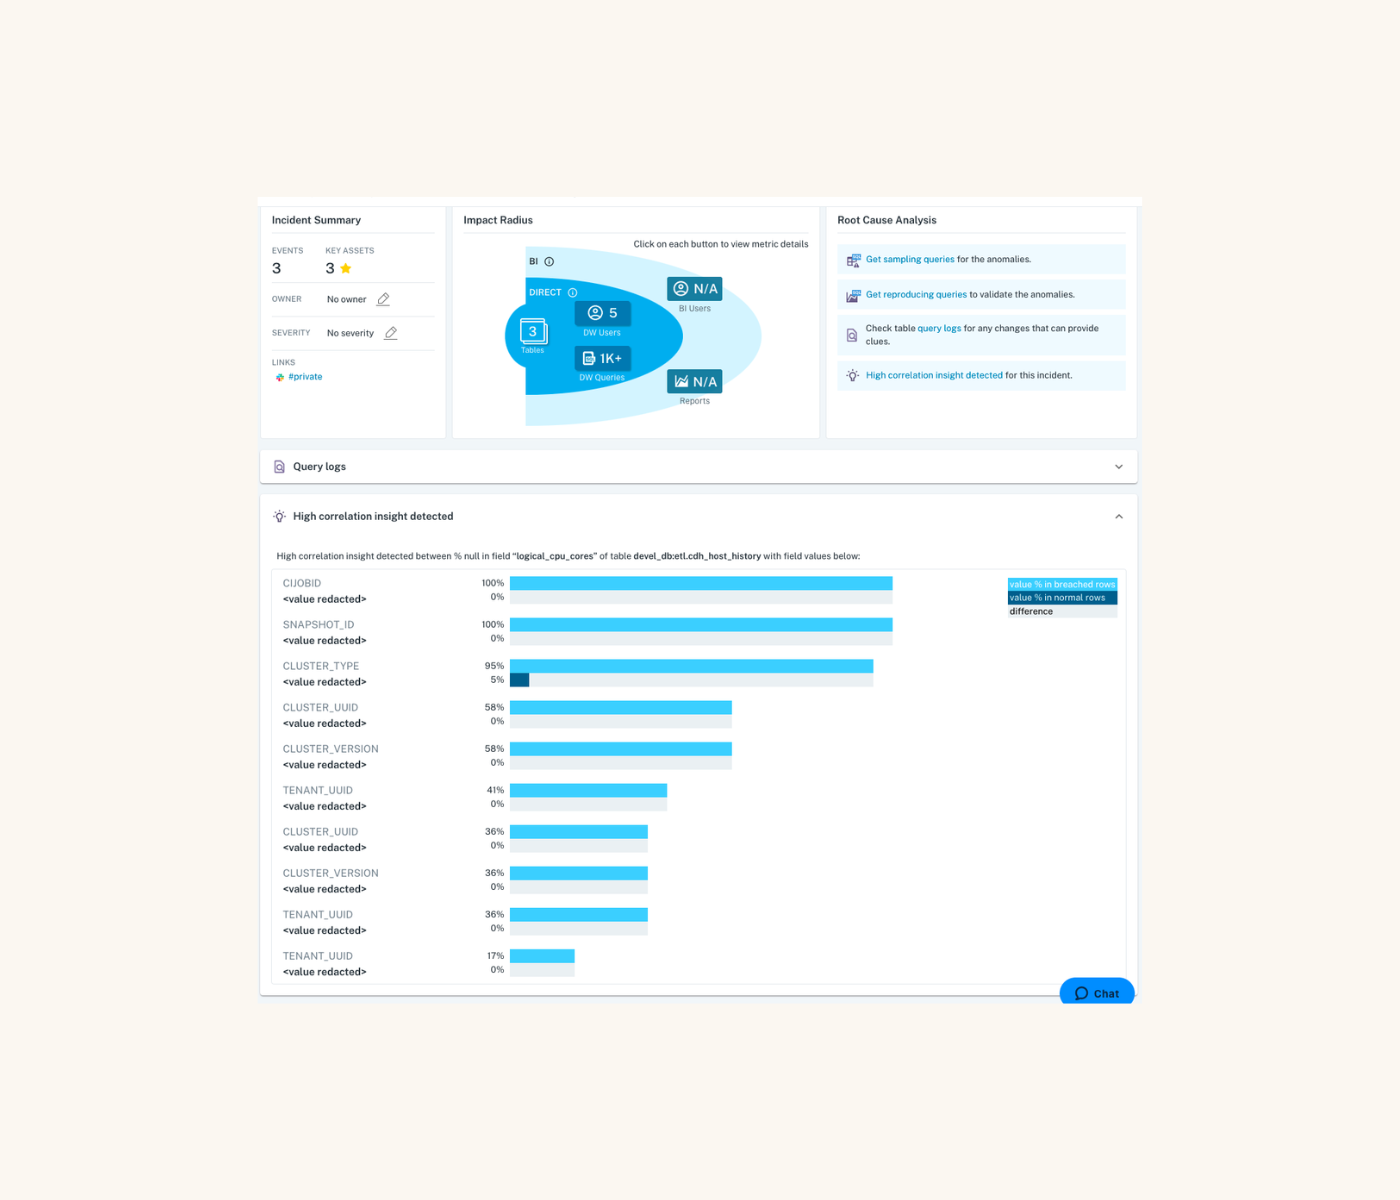
- Monitor and detect: (What went wrong?)
- Alert and triage: (Who should be notified and when?)
- Investigate: (Why did it happen and what’s the impact?)
Gartner goes on to explain that some data observability solutions will also go one step further by even recommending solutions to answer the ultimate question: “How can this be fixed?”
As they describe it, “[some] issues are critical and require immediate solutions” and specific vendors will extend their value by leveraging root cause analysis tools to provide tangible recommendations to fix those problems, although “Only vendors with advanced technologies offer this feature in their data observability tools… This is a differentiating factor among vendors.”

Our perspective:
The Gartner description of data observability—and its capabilities—directly aligns with Monte Carlo’s own. When we created the category in 2019, we did so under the belief that the ability to detect and resolve data quality issues faster—and improve data health over time—was the most important value we could provide to enterprise data teams.
And five years and one Market Guide later, we’re more convinced than ever.
What data observability monitors
According to Gartner, data observability solutions should monitor five key areas:
- Data content: ensuring the quality and validity of the data itself
- Data flow and pipeline: preventing interruptions within the pipelines
- Infrastructure and compute: monitoring the evolution of code and compute consumption over time
- User, usage, and utilization: helping teams understand how data is being used and by whom
- Financial allocations: helping teams optimize the resource cost of their data and pipelines over time
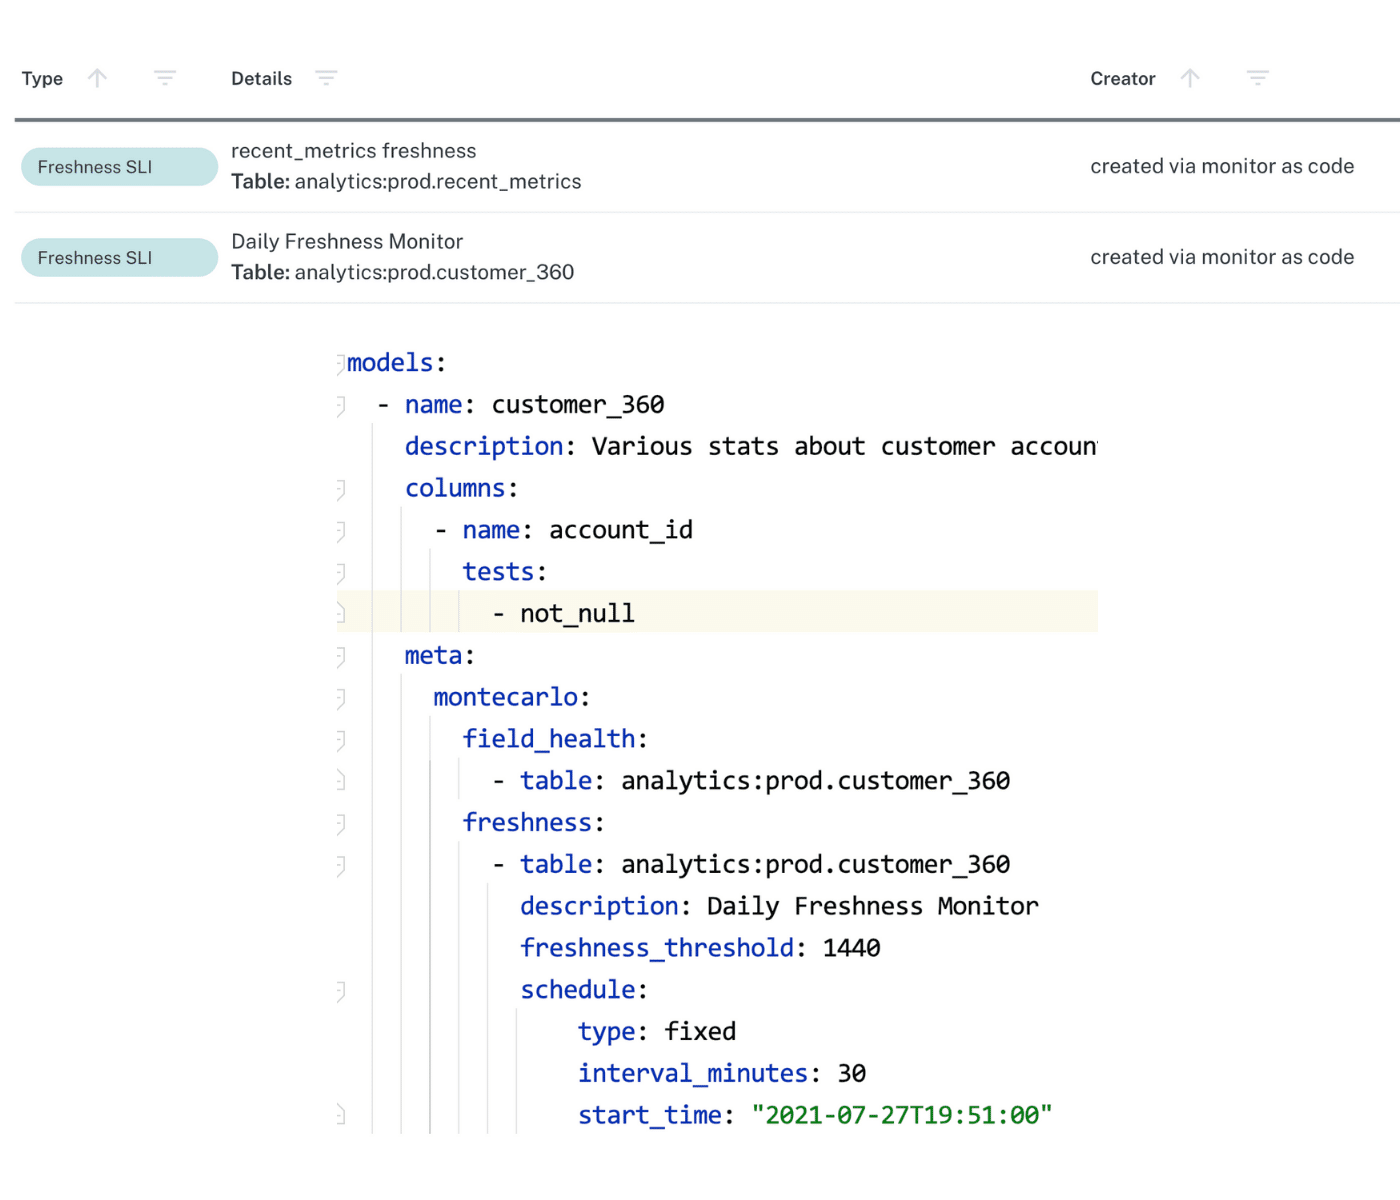
For example, by extending automated data quality monitoring, data quality testing, and lineage features to the data, system, and code levels of the data stack, Monte Carlo empowers data teams to observe, manage, and measure the quality and performance of each of these areas at scale over time.
Comparing data quality vs data observability
According to Gartner, static event based monitoring isn’t sufficient for complex data systems.
“Static, event-based monitoring is no longer sufficient to effectively manage data systems and prevent critical events. Modern data architectures are too complex and dynamic for those methods to provide a holistic view of data’s health across data ecosystems at various stages of its life cycle.”
In addition to discussing what the data observability category is, Gartner also makes a point to explain how it’s both different and complements traditional data quality approaches, as well as the vendors placed in their augmented data quality category that have their own critical capabilities—some of which overlap.
In short, the report highlights that these two technologies overlap in four key areas:
- Data profiling
- Data quality/data content monitoring
- Metadata management
- Data lineage
Where they differ is in their scope, implementation, and ultimate priorities.
As Gartner states, “Data quality is concerned with data itself from a business context, while data observability has additional interests, and it concerns the system and environment that deliver that data. Data quality provides data remediation capability and helps fix data issues, whereas data observability offers monitoring and observation as a baseline and may provide recommendations to fix the issue.”
Our perspective:
How Gartner differentiates between traditional data quality monitoring and data observability is crucial for understanding their mandatory features. In our experience, static, event-based monitoring – SQL monitors, data testing, etc. – aren’t enough to maintain high-quality data standards for enterprise data teams, because:
- It doesn’t provide coverage at the system and code level
- It doesn’t integrate end-to-end
- It doesn’t easily scale across growing data environments
- And it’s difficult to anticipate all the ways data could break.
Moreover, Gartner highlights that traditional monitoring tools are also insufficient to address unknown issues. This is because manual monitors can only detect what data teams know to create monitors for—not the issues they don’t.
In the words of Gartner:
“Data observability tools learn what to monitor and provide insights into unforeseen exceptions. They fill the gap for organizations that need better visibility of data health and data pipelines across distributed landscapes well beyond traditional network, infrastructure and application monitoring.”
Considering embedded vs. standalone data observability solutions
According to Gartner, there are two types of data observability tools in the market: embedded tools and stand-alone tools.
An embedded tool is a feature that’s embedded or integrated natively into an existing application or software platform like a data warehouse or ETL solution.By contrast, stand-alone tools may offer deep integrations and partnerships with other platform tooling, but are provided independently by a third-party vendor.
The primary difference between these two approaches is their ability to integrate and provide observability end-to-end.
According to Gartner: “Embedded tools are embedded or integrated into specific applications areas or environments and provide a seamless process for specific observability within their own platforms to identify data issues. However, they are not intended to provide an end-to-end visibility across five different observations and are difficult (if not impossible) to use outside of the main tool or environment that data observability tool is embedded in.”
Our perspective:
The primary conceit of data observability is the comprehensive picture of data health and the ability to effectively manage that health over time. The challenge with point solutions is that they don’t generally play well with others and they tend to be inextensible by design.
A transformation tool might be able to detect a bad transform, but what if the data was wrong before it landed? Even the leading cloud data warehouse and lakehouse platforms are taking a walled garden approach to data quality, creating tools that cover a specialized point in the pipeline but neglect the problems upstream and downstream of their domain. What’s more, this walled-garden approach makes it difficult to evolve an architecture over time.
In contrast, true end-to-end data observability tools are platform agnostic by design and provide the kind of holistic view required (at each level and component of the data environment) to promote reliability at scale over time. This emphasis on pipeline reliability over point-based quality empowers data trust across domains and optimizes the value an organization can derive from its data assets regardless of stack or use-case.
When do you need data observability?
While Gartner expects 60% of the available market to adopt data observability by 2026, the vast majority of enterprise companies are still in the discovery phase.
Which begs the question: How do you know when you need data observability?
To answer that question, Gartner recommends considering the following questions first:
- Does your data team have SLAs that often aren’t met?
- Do your data team have complex data delivery systems that aren’t always meeting the needs of the organization?
- How are you ensuring data quality in your gold tables or highly critical pipelines?
Understanding the impact of data quality issues on your critical pipelines is the first step to understanding the value of a data observability solution. You can also check out our data quality calculator to understand the potential ROI of data observability over time.
Of course, data observability alone won’t solve your data quality problems. A true data quality strategy is a mix of technology and process. As Ashley Van Name, JetBlue’s Senior Manager of Data Engineering, says,
“An observability product without an operational process to back it is like having a phone line for 911 without any operators to receive the calls.”
Ready to learn about data observability right from the source? Grab a time to chat with our team in the form below.
Our promise: we will show you the product.
Disclaimer:
Gartner does not endorse any vendor, product or service depicted in its research publications and does not advise technology users to select only those vendors with the highest ratings or other designation. Gartner research publications consist of the opinions of Gartner’s research organization and should not be construed as statements of fact. Gartner disclaims all warranties, expressed or implied, with respect to this research, including any warranties of merchantability or fitness for a particular purpose.
This graphic was published by Gartner, Inc. as part of a larger research document and should be evaluated in the context of the entire document. The Gartner document is available upon request from Monte Carlo.
GARTNER is a registered trademark and service mark of Gartner and Magic Quadrant & Hype Cycle are registered trademarks of Gartner, Inc. and/or its affiliates in the U.S. and internationally and are used herein with permission. All rights reserved.
Read more posts.