Introducing Table Health Dashboard, a Better Way to Track Data Quality Coverage at Scale
As companies ingest larger volumes of data and pipelines grow increasingly complex, data engineers need a way to quickly and holistically understand the health and accuracy of their data.
Poor data quality costs companies millions of dollars per year, impacting over 26% of their revenue and eroding customer trust, according to a 2022 survey by Wakefield Research. It also wastes precious time, with data engineers spending upwards of 40 percent of their time – or 120 hours per week – firefighting and resolving data incidents.
Historically, companies have leveraged data cataloging solutions with documentation to track table health, a tedious and time-intensive process that requires frequent updates when tables are refreshed, incidents occur, or new tests deployed. These and other manual approaches make it difficult to measure data health over time, as well as scale data quality coverage as data volumes grow.
Last year, we released our Data Reliability Dashboard to help data teams and their stakeholders to understand and communicate the reliability of their data across several key metrics and SLAs. Taking our vision for end-to-end, automatic data reliability a step further, we’re excited to announce the launch of Table Health Dashboard, a new way for data teams to measure and improve the data quality across their most critical tables.
Read on to learn more.
Automatically track data reliability for your key tables
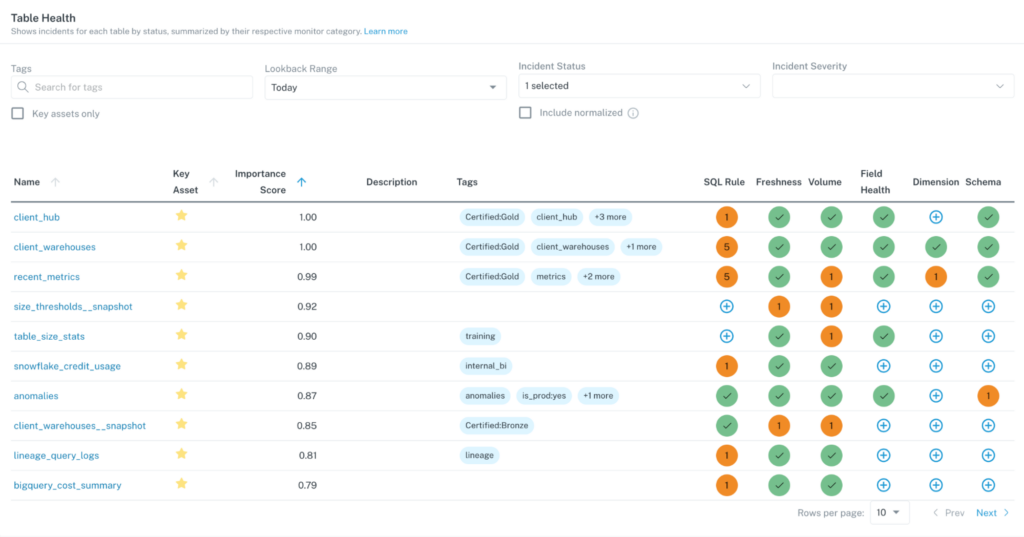
Table Health Dashboard, available today, provides an automatic, all-in-one view of table health across several key pillars of data observability, including freshness, volume, and schema, as well as specific SQL rules.
Tables are also filtered by asset relevance using an importance score that leverages metadata to understand the number of times a given object is referenced in queries and BI dashboards. By ranking table importance, data engineers can more easily triage and mitigate data quality incidents as they arise, and focus exclusively on data assets that impact your business.
Table Health Dashboard also surfaces incidents per table, summarized by incident type and monitor category. More granular information about incidents at the table level can assist with data health SLA tracking and ensuring data quality coverage where it’s needed most.
Seamlessly create new monitors from your Table Health Dashboard
With this release, users can spin up new monitors directly from the Table Health Dashboard UI, ensuring teams can keep data quality coverage up to date as data volumes grow. This streamlined monitor creation workflow also makes it easy to specify the field, monitoring schedule, and relevant monitor documentation.
To dive into other new releases, check out our docs.
Interested in learning more about how Monte Carlo’s Table Health Dashboard helps leading data teams improve data reliability at scale? Reach out to the team for a demo!
Our promise: we will show you the product.
 Product demo.
  What is data observability?
 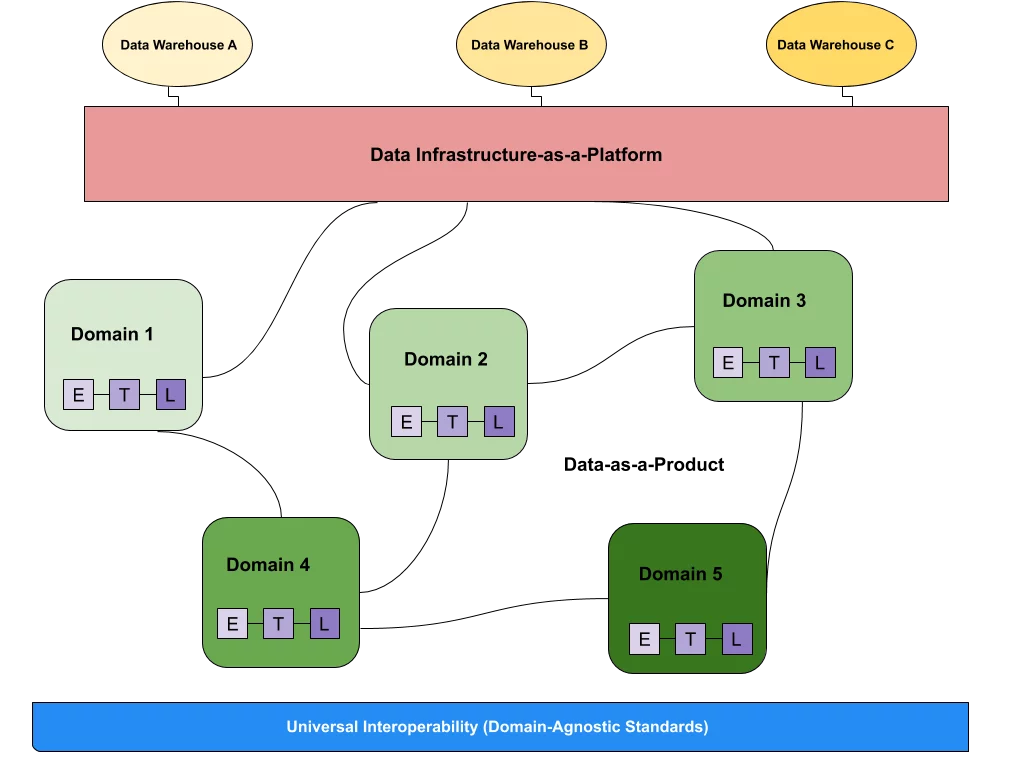 What is a data mesh--and how not to mesh it up
 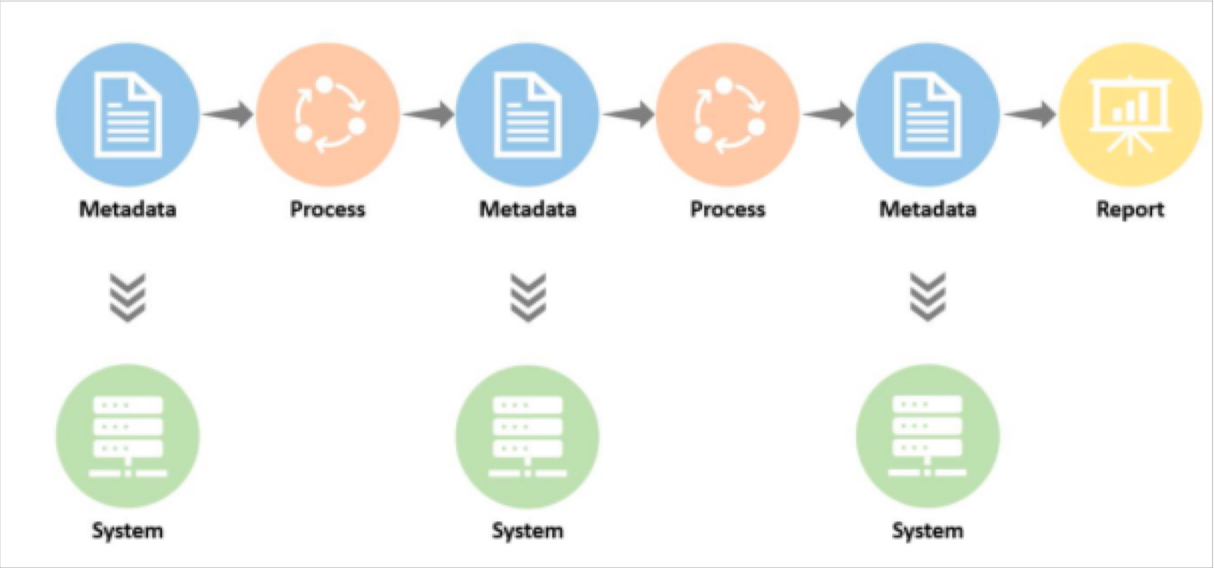 The ULTIMATE Guide To Data Lineage


