Incident Prevention for Data Teams: Introducing the 5 Pillars of Data Observability

As companies increasingly depend on rich, unstructured data to inform decision making, it’s mission critical that this data is accurate and reliable. Unfortunately, the reality is that data can go be missing, be improperly added, erroneously changed, or otherwise go “down.” By applying similar principles of DevOps Observability (think: traces, logs, and metrics), data teams can achieve similar levels of visibility into the health and reliability of their data with five key pillars of Data Observability. Here’s how.
Bad data spares no one, least of all the data engineers and analysts working directly with the workflows, pipelines, and dashboards responsible for aggregating, transforming, and visualizing it. Industry leaders call this problem “data downtime,” and it refers to periods of time where data is missing, erroneous, or otherwise inaccurate.
To prevent data downtime, data teams need to keep a pulse on the health of their data, which is often easier said than done. When I was at Gainsight as VP of Operations, a day would rarely go by when one of these questions weren’t asked by one of my stakeholders:
- Is the data up-to-date?
- Is the data complete?
- Are fields within expected ranges?
- Is the null rate higher or lower than it should be?
- Has the schema changed?
Not having the answers would lead to confusion, frustration, and not to mention embarrassment when an exec or customer would ping me to ask “what happened to my data?”
Perhaps you can relate?
After speaking to over 200 data teams over the past few years, the desire for answers to these questions came up time and again. Across companies and industries, the results of not having reliable, accurate data were often the same: (1) tedious, time-consuming data fire drills (5 a.m. wakeup calls, anyone?) (2) loss of revenue to the tune of millions of dollars per year and (3) erosion of customer trust. Data reliability was fundamentally important to the success of any business, and yet there wasn’t a holistic, dynamic approach to achieve accurate data.
Fortunately, there’s a better way: Data Observability.
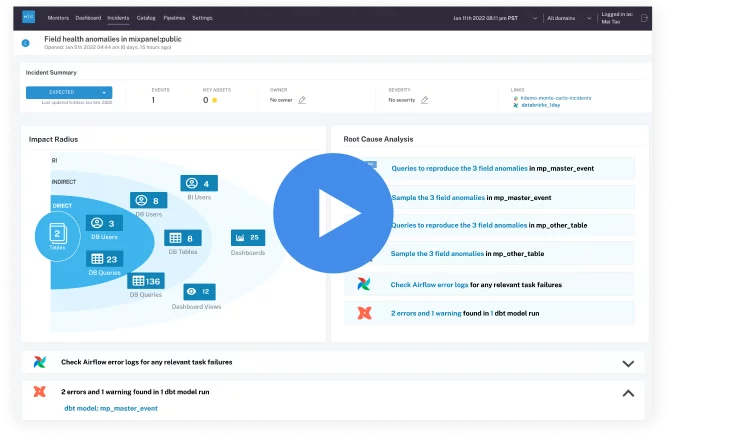
Data Observability refers to an organization’s ability to fully understand the health of the data in their system, eliminating periods of data downtime by applying best practices of DevOps Observability to data pipelines. Like its DevOps counterpart, Data Observability uses automated monitoring, alerting, and triaging to identify and evaluate data quality and discoverability issues, leading to healthier pipelines, more productive teams, and happier customers.
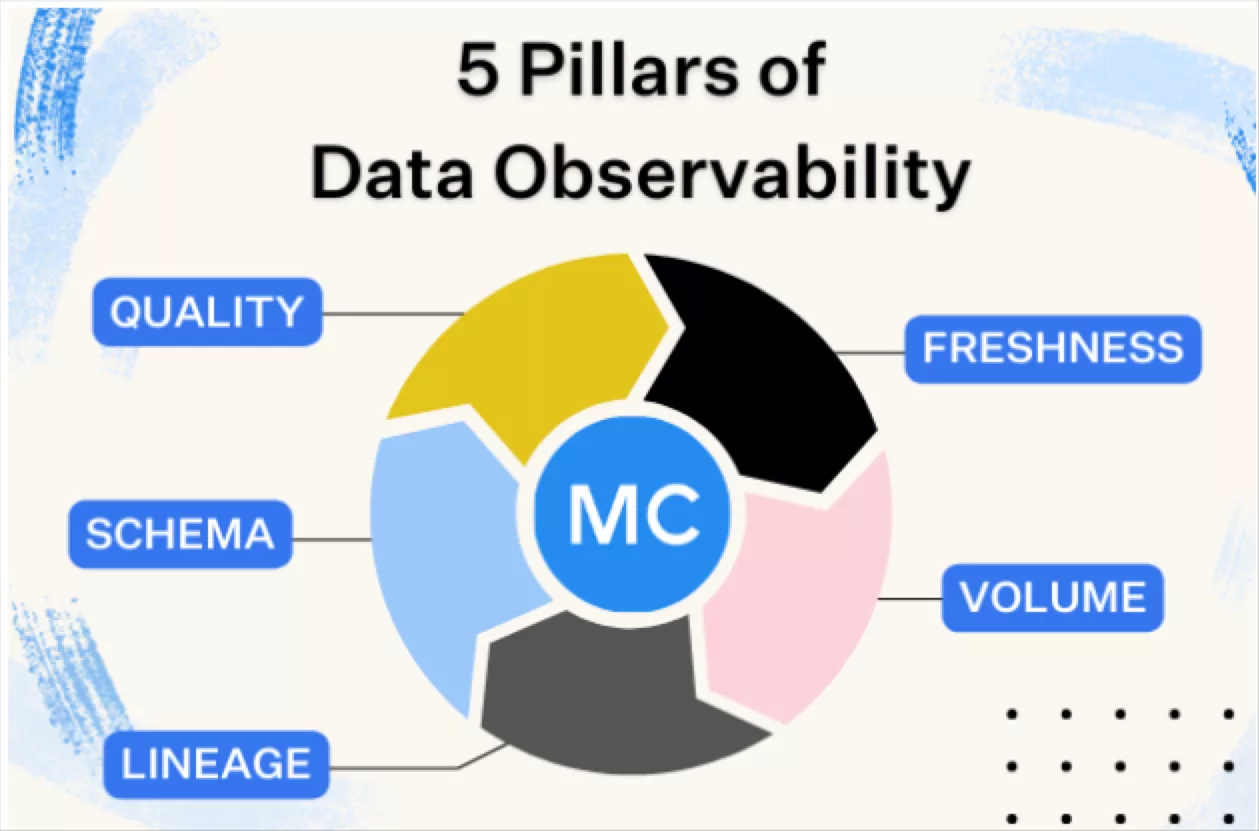
Similar to the three pillars of DevOps Observability, I discovered that Data Observability can be split into five key pillars representing the health of your data, including freshness, distribution, volume, schema, and lineage.
Freshness
Data pipelines can break for a million different reasons, but one of the primary culprits is a freshness issue. Freshness is the notion of “is my data up-to-date? What is its recency? Are there gaps in time when the data has not been updated and do I need to know about that?” among many other questions.
Distribution
The second pillar focuses on distribution, which relates to your data assets’ field-level health. Null values are one metric that helps us understand distribution at the field-level. For example, for a particular field, if you typically expect a specific percent null rate, and then suddenly that spikes up in a very significant way, you may have a distribution issue on your hands. In addition to null values, other measurements of a distribution change include abnormal representation of expected values in a data asset.
Volume
Volume quite literally refers to the amount of data in a file or database, and is one of the most critical measurements for whether or not your data intake is meeting expected thresholds. Volume also refers to the completeness of your data tables and offers insights on the health of your data sources. If 200 million rows suddenly turns into 5 million, you should know.
Schema
The fourth pillar is schema, in other words, a structure described in a formal language as supported by a database management system. Oftentimes we find that schema changes are the culprits of data downtime incidents. Fields are added or removed, changed, etc. tables are removed or not loaded properly, etc. So auditing or having a strong audit of your schema is a good way to think about the health of your data as part of this Data Observability framework.
Lineage
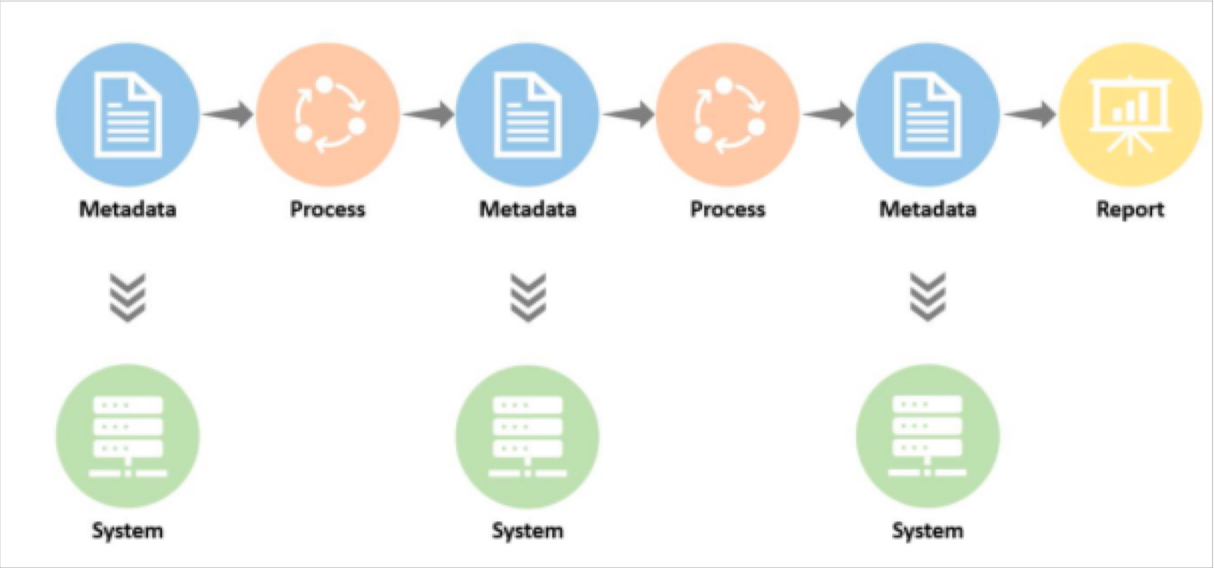
The last, and perhaps most holistic pillar, is lineage. Lineage helps us put all four of the preceding pillars together in one so we can paint the map of what your data ecosystem looks like. In fact, when data breaks, the first question is always “where?” Data lineage provides the answer by telling you which upstream sources and downstream ingestors were impacted, as well as which teams are generating the data and who is accessing it. Good lineage also collects information about the data (referred to as metadata) that speaks to governance, business, and technical guidelines associated with specific data tables, serving as a single source of truth for all consumers.
Lineage helps us tell a story about the health of your data, for instance, “upstream there was a schema change that resulted in a table downstream that had a freshness problem that results in another table downstream that had a distribution problem that resulted in a wonky report the marketing team is using to make data-driven decisions about their product.”
The future of Data Observability
Thanks to our friends in DevOps, we have an easy lens with which to view the importance of observability as applied to data. By surfacing data downtime incidents as soon as they arise, the five pillars of Data Observability provide the holistic framework necessary for true end-to-end reliability that some of the best data teams are already applying as a standalone layer of their data stacks.
A Data Observability layer literally “observes” data assets from end to end, alerting data engineers and analysts when issues arise so they can be addressed before they affect the business.
In future articles, we’ll discuss what Data Observability looks like under the hood, but until then: here’s wishing you no data downtime!
Interested in learning more about Data Observability? Reach out to Barr Moses and the team. Book a time to speak with us using the form below.
Our promise: we will show you the product.
 Product demo.
  What is data observability?
  What is a data mesh--and how not to mesh it up
  The ULTIMATE Guide To Data Lineage


