Product demo.
  3 Steps to AI-Ready Data
  What is a data mesh--and how not to mesh it up
  The ULTIMATE Guide To Data Lineage
 Measuring Data Quality at the Use Case Level


Michael Segner
Michael writes about data engineering, data quality, and data teams.

Bryce Heltzel
Bryce is a product manager at Monte Carlo. Previously, he served as an engineer at Looker and Google.
Measuring the progress of a data quality initiative is not as straightforward as it seems.
One of the biggest reasons for this is because data quality is use case specific. For example, the accuracy required for a machine learning application may only need to be directional whereas a finance report may need to be accurate to the penny.
To this end, we are happy to introduce our latest Data Quality Dashboard.
Whereas the recently launched Data Operations Dashboard answers what issues surfaced and how well they were resolved, the Data Quality Dashboard looks specifically at how well the data fits defined use cases. The dashboard provides:
- A real time view of current quality, including detailed information about current issues, allowing data stewards to triage, prioritize and track problems in their domain.
- An overview of past quality trends, allowing governance managers and data stewards to measure the effectiveness of their data quality efforts.
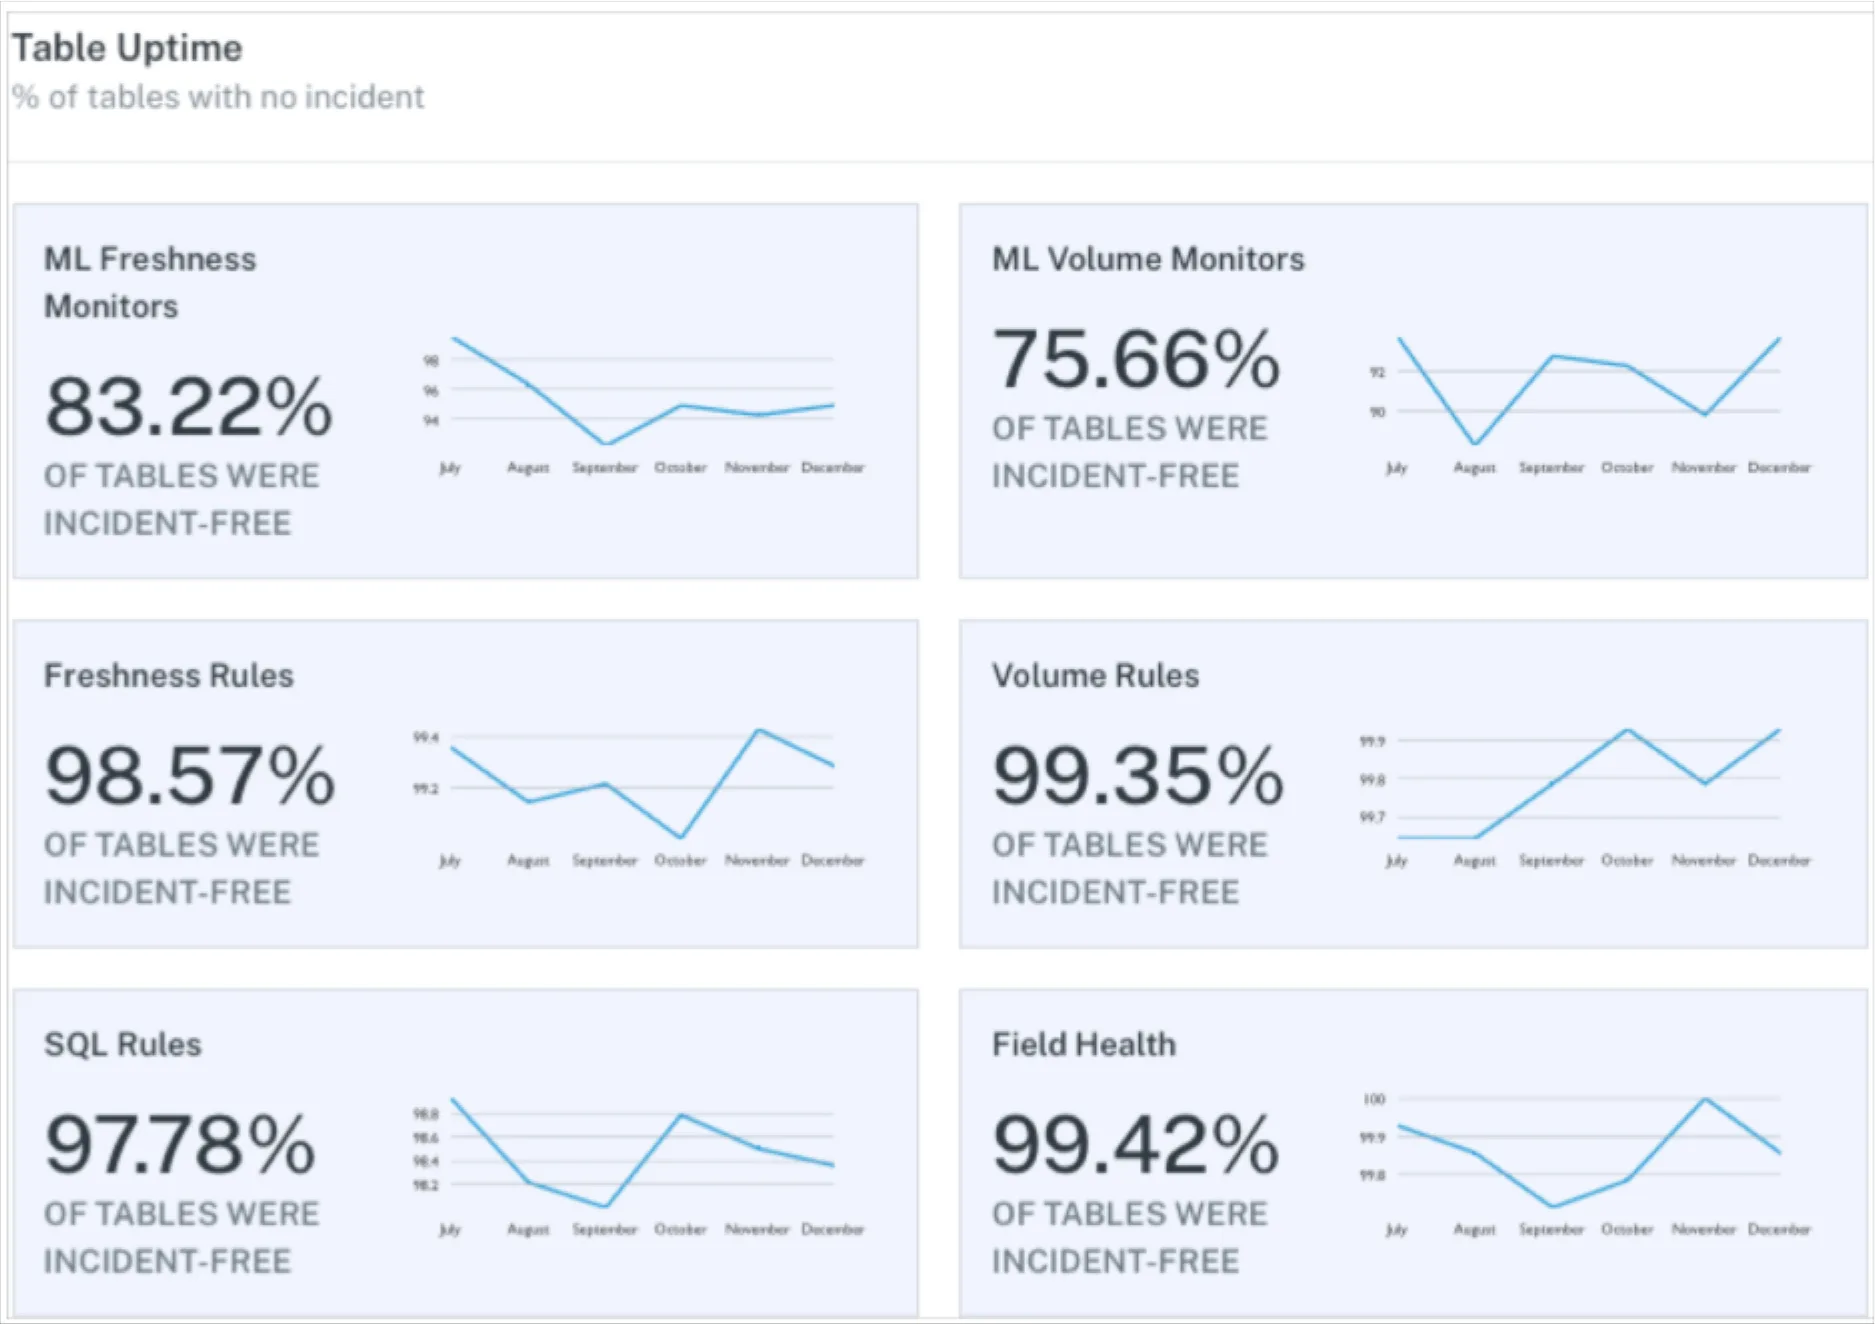
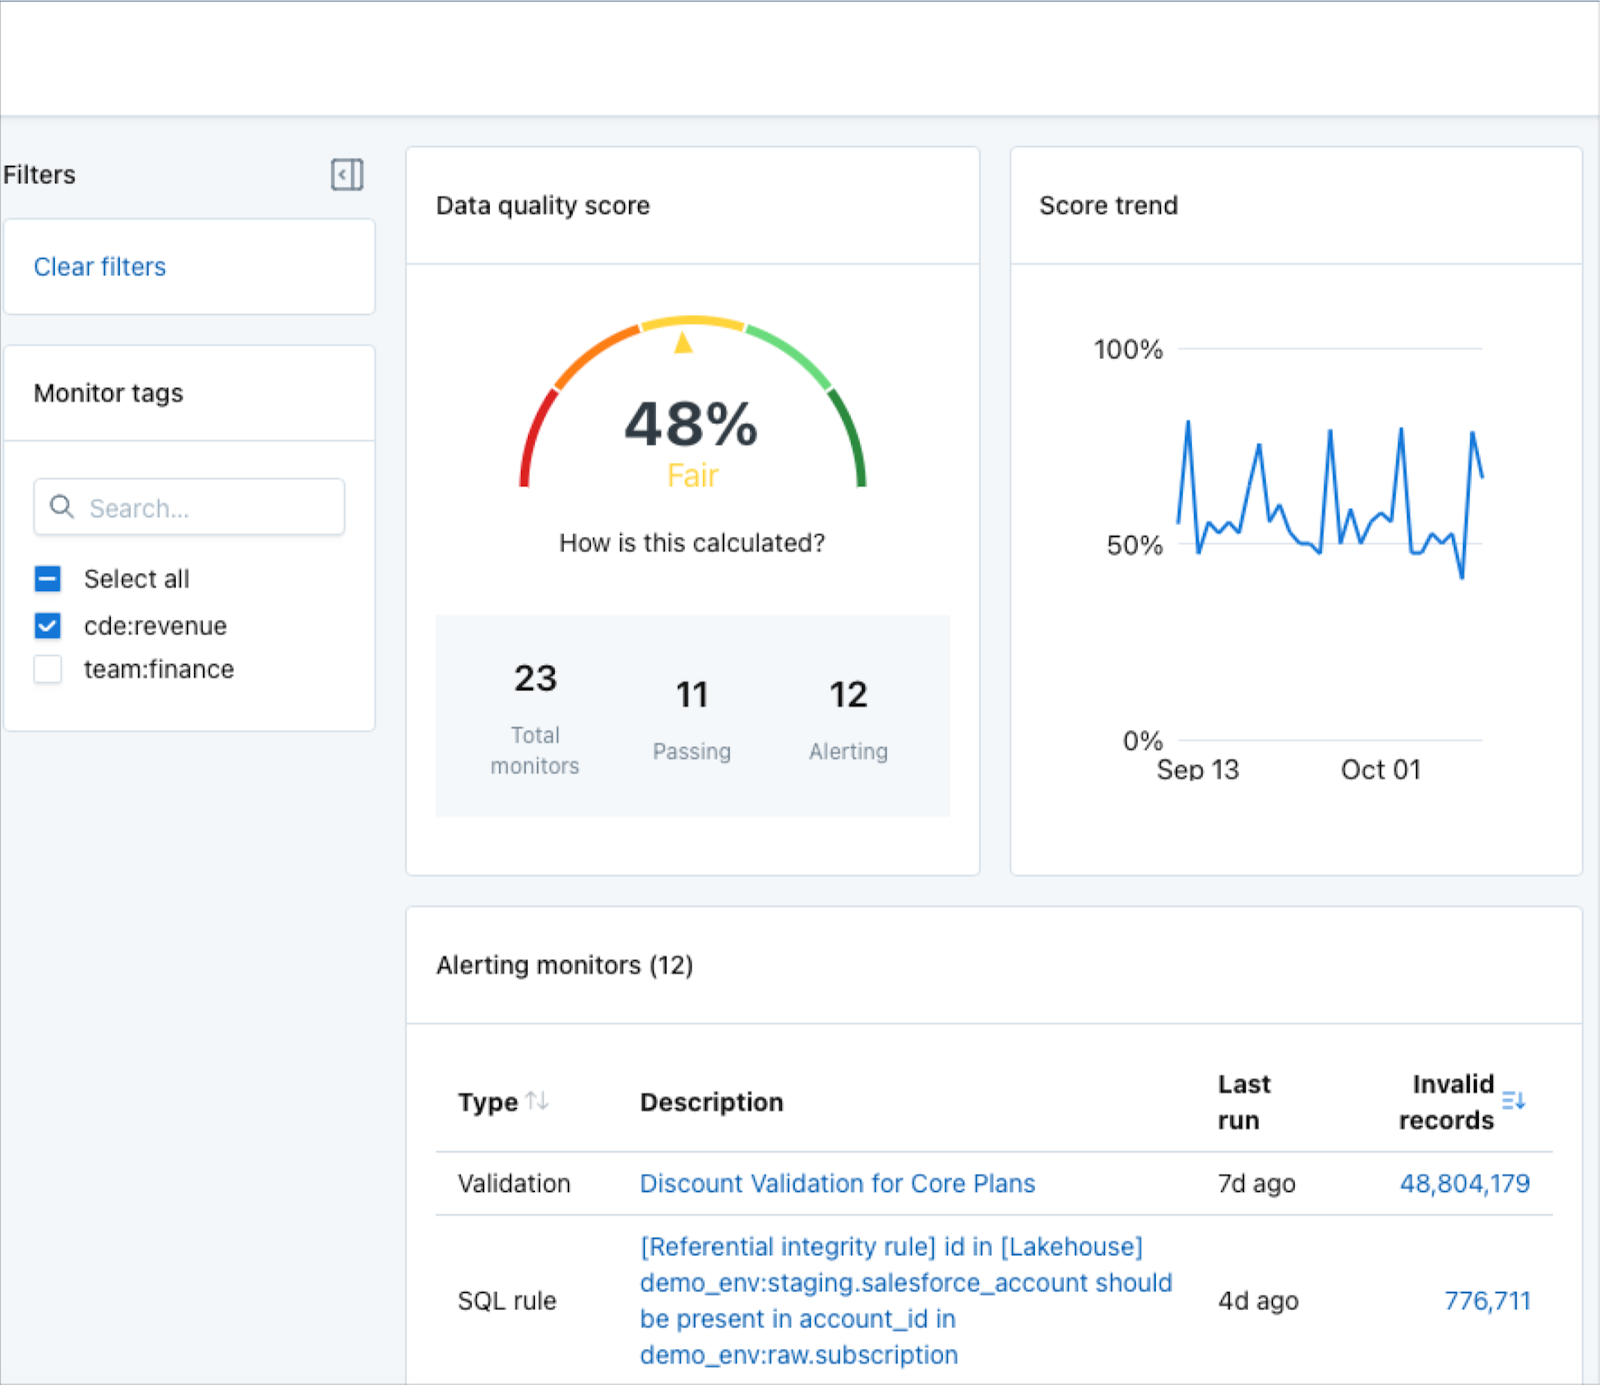
To use the dashboard, users simply tag their data monitoring rules as they are created:

Monte Carlo will then automatically calculate the data quality score for any combination of tags based on the number of rules that are passing versus failing. Score trend will track the pass rate over time based on the rules that ran on any given day.
Some examples of how tags can be used to drive powerful, meaningful reporting include:
- Teams: For example, say you have a customer table used across multiple teams/domains. Monitors owned by the finance and sales operations teams could be tagged and tracked as team:finance and team:sales-ops accordingly.
- Data products: You may want to measure the data quality of a particular data product. For example, it can be helpful not to just have rules on the last-mile gold table, but on the raw tables as well. The overall data quality for a specific data product might be tracked with tags like data-product:salesforce_revenue or project:revenue_reliability. This can help data teams be more proactive and work with their stakeholders to set and track SLAs for each data product.
- Critical data elements: Oftentimes data governance teams will identify a set of critical data elements that have particular importance to business operations. For example, all rules that monitor the quality of the total_revenue field, wherever that field appears, could have a tag like cde:total_revenue.
- Data contracts: Regardless of how a data team defines the term data contract, there is typically a need to hold a data producer (whether internal or external) to a standard of data quality. This producer or data source is likely feeding multiple tables and the quality of the data they provide could be measured with a monitor tag like data-contract: invoice_application.
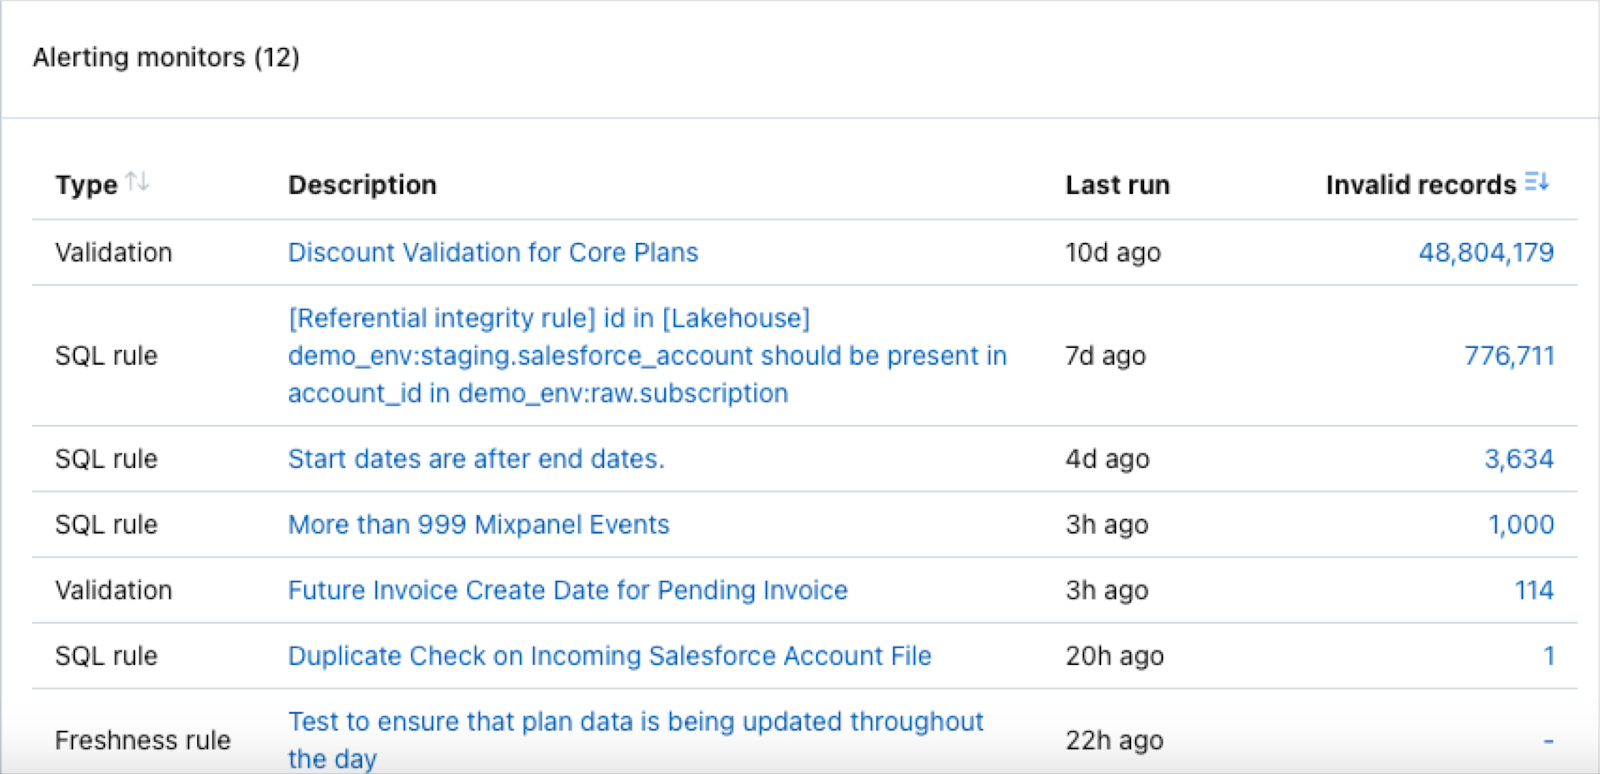
The Data Quality Dashboard can also serve as a command center for data stewards to triage issues. Each alerting monitor is surfaced and can be easily ordered by the number of invalid records making it easy to prioritize which incident to tackle next.
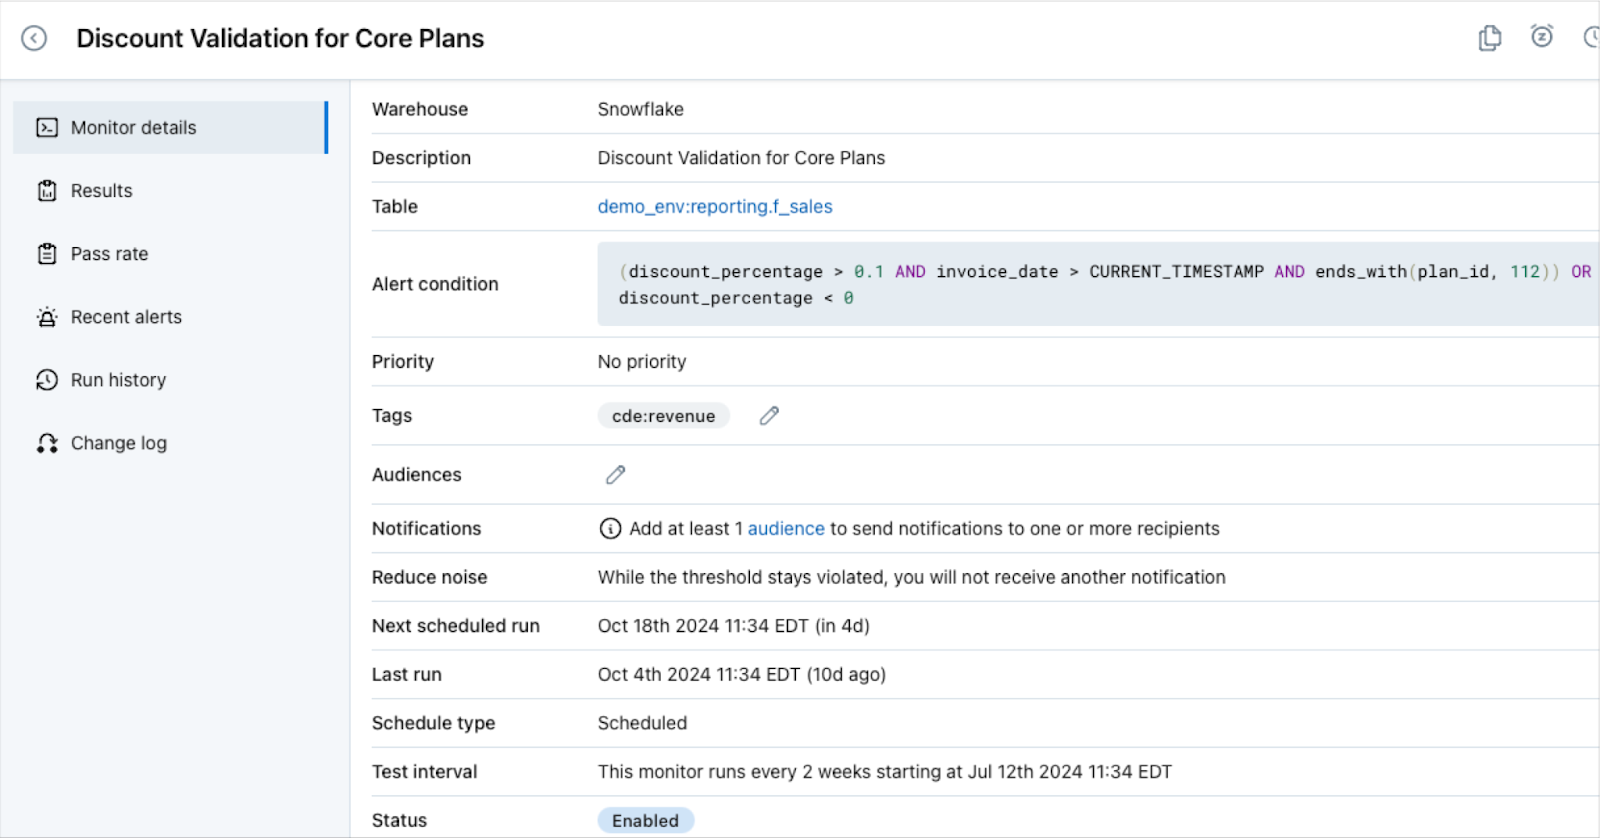
And of course: rich context about tagged rules, the nature of their alerts, and how to resolve issues are just a click or two away.
Investing in Incident Management & Resolution

Traditional data quality approaches have focused solely on detection at the expense of facilitating incident management and resolution.
Monte Carlo is investing significant resources into making it easier for data teams to triage, resolve, and measure data quality issues. For example, we’ve recently announced new features to help data teams identify when code changes are the root cause of data anomalies.
We will also continue to evolve our dashboard and reporting features with a focus on new ways to help teams understand their relative monitoring coverage and risk levels.
Curious to learn more about data observability? We’re always interested in hearing from you!
Our promise: we will show you the product.
Read more posts.