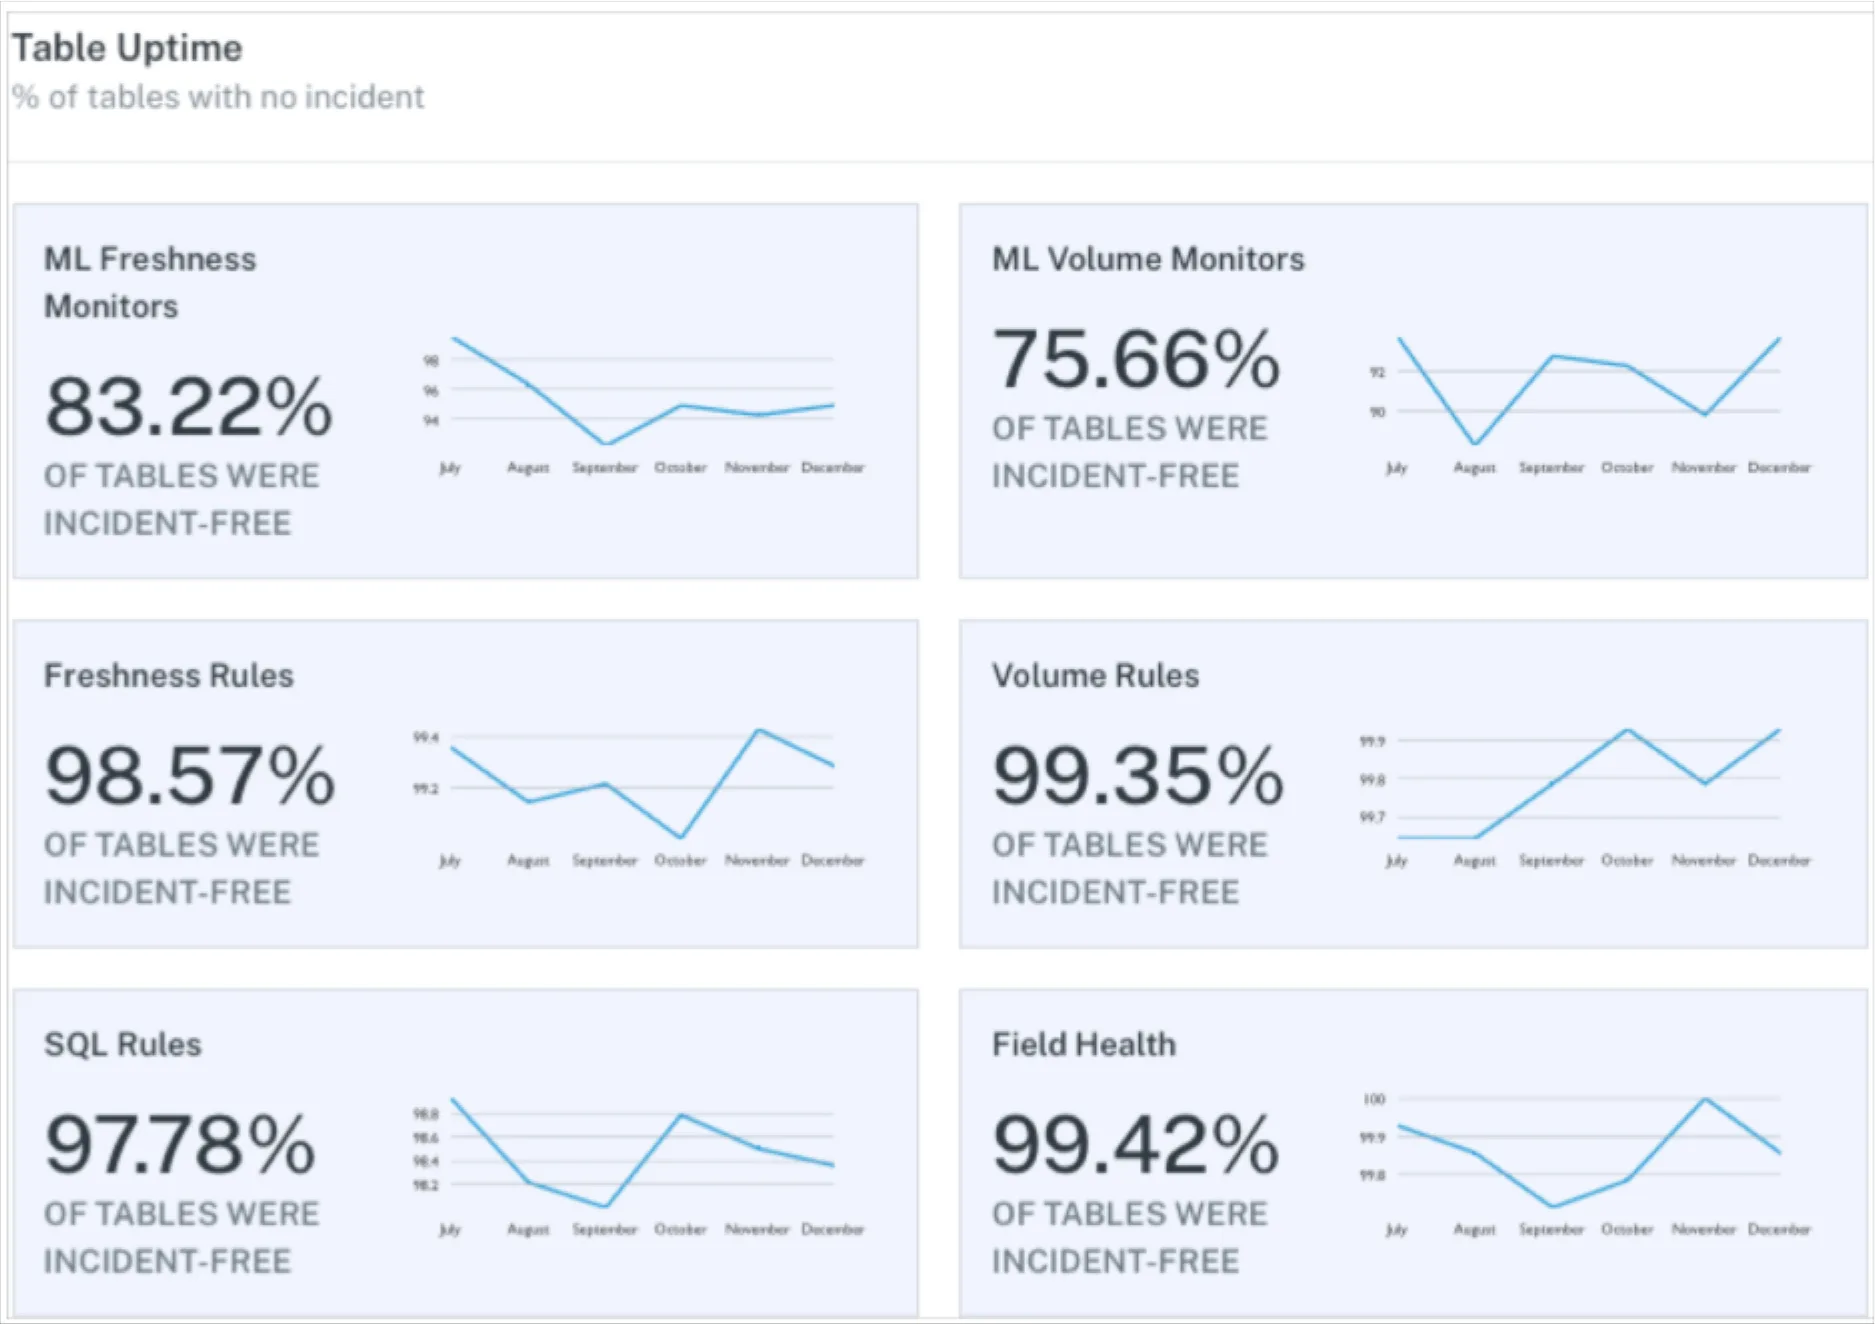
Measure The Impact Of Your Data Platform With These Metrics

For many data teams, the past 5 years has witnessed an evolution of technology, teams, and processes that calls to mind another significant period in time: the Industrial Revolution.
From the late 18th century to mid-19th century, the Industrial Revolution transformed economies with new tools, cheaper power sources, and more streamlined ways of organizing work in factories. And even now, visit a modern printing plant and you’ll find a state-of-the-art operation with advanced tech and robotics.
In 2022, a rapid move to cloud technologies, an insatiable and growing demand for the application of data across the company, and the construction of “the data platform” have made data science, analytics, and machine learning faster, cheaper, and more accessible than ever before.
Data platforms, in particular, have turned data infrastructure into factories of scale and speed, feeding our insatiable appetite for insights, operational efficiencies, and even new revenue streams.
Still, it’s one thing to build a data platform. How do we know it’s actually living up to this vast potential? Fortunately, three key success metrics (user, maturity, and impact metrics) can clue us in on its success – here’s how.
What is a data platform?
Before we dive any deeper, it probably helps to describe what we mean by data platform. In this definition, the data platform might be thought of as similar to a printing plant – you may have:
- Delivery mechanisms (in & out) and warehouses:
- Raw materials that will be refined into finished products
- User applications for internal or external stakeholders of the plant
- Machines applications to optimize printing processes for greater efficiency or return
- End-to-end quality controls to ensure the products are delivered on time, within budget, and to specification
In my former role as SVP of Data & Insights at the New York Times, I oversaw a data platform that encompassed these same core components:
- Data management infrastructure (i.e. delivery mechanisms / ELT, warehouse)
- Key data assets (i.e. raw materials -> finished products)
- User Applications – BI, Experimentation, CDP
- Machine Applications – algorithmic recommendations, algorithmic targeting, etc.
- Data observability, privacy & governance tools (i.e. end-to-end quality controls)
Ultimately, your specific organization’s needs will determine the scope and breadth of the data platform, but I expect many of these components are shared irrespective of your goals.
It’s imperative that we can measure and communicate the progress and success of the data platform, in order to justify the initial investment and any future growth & investment. But what does success look like for a data platform, and how do we measure our progress?
What does data platform success look like?
I came to the conclusion that success of the data platform can be represented along three dimensions:
- Breadth of customers & applications: An effective data platform will serve a myriad of teams, user profiles, and use cases (e.g. domain-specific analytics, deadly-accurate reporting, cutting-edge machine learning)
- Building for the future: A more mature platform will be able to cater to new and unanticipated use cases, such as the onboarding of a new line of business or the prototyping of a new machine learning application, without significant work on the underlying platform.
- Delivering business impact today: Few of us have the time and luxury to build the platform of the future, if we aren’t serving the needs of the business today, such as improving ad targeting or supporting decision making with faster experimentation.
In order to gauge progress along these dimensions, I found a range of measures to be useful, namely: usage, maturity, and impact. By tracking these three metrics, data teams can balance near-term business impact with longer-term advances and maturity, while keeping a pulse on the growth and engagement of their user base.
All three are critical indicators that your data platform is working – or not – and striking the right balance of all three can pay dividends (no pun intended) when it comes to validating your team and technology’s worth to the rest of your business.
User metrics
Are you seeing the necessary engagement and satisfaction with your data platform?
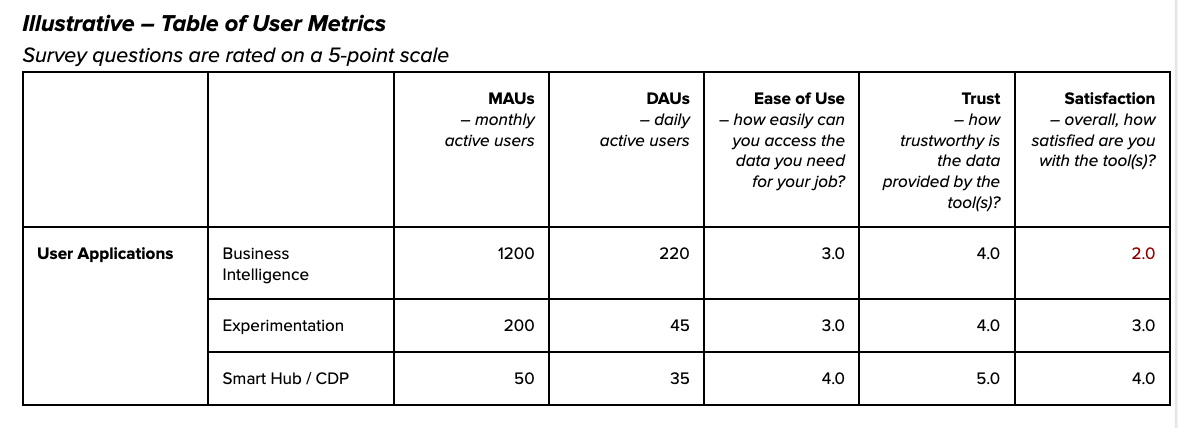
Apply the same level of rigor to your measurement of platform usage as you would a customer-facing product. Measure the footprint and speed of adoption, and run surveys to understand their satisfaction. While you should keep these surveys very short, it can also be an opportunity to gauge the drivers of their satisfaction, such as trust in the data / tools and ease of use.
For example, a common problem (illustrated below) in the realm of “data democratization” is to encounter low satisfaction levels for your business intelligence tool (e.g. avg 2.0 on a 5-point scale), despite off-the-charts usage of a subset of dashboards, often representing frustration with the lack of data exploration available to the user!
At the team level, I’ve seen this measurement paired effectively with qualitative feedback to drive the features we are building to meet current and future needs of the user base.
Maturity metrics
Are you advancing the technical maturity of your platform, anticipating and building ahead of today’s needs?
At the highest level, you want to be able to say – are our platforms falling behind, keeping pace with, or forging ahead of the business needs?
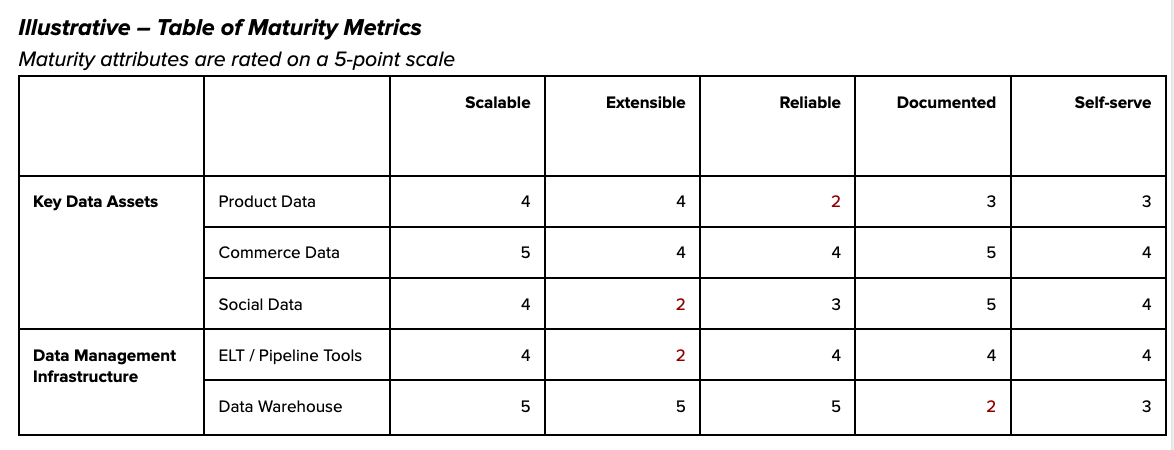
At the team level, maturity will need to be more specific in order to be actionable; gauging across teams whether your products and services are scalable and extensible, reliable and well-governed, and allow for adoption with minimal support. I’d recommend your teams start by self-scoring their data systems.
In the illustrative example below, if we determine that our centralized Product Data assets lack reliability, this can dictate work to be done in the upcoming quarter to increase observability and reliability of the data assets.
Similarly, we may determine that our infrastructure teams should focus on ELT tool extensibility and warehouse documentation.
Impact metrics
Is your data platform delivering measurable value today?
At the highest level, we must be able to quantify the impact driven by the platform, either in monetary terms ($, €, £) or a common unit of measurement that determines business success (e.g. sales, subscriptions). Precision is not the goal here – you can often tell if your platform bets are paying off by the order of magnitude of the value generated.
Value delivered is most visible from the applications to optimize product features or business processes. While it has become common-place for projects to measure the incremental lift in relative terms (e.g. 30% lift in conversion rate), you should ensure your teams are translating that lift into incremental value to the business.
In the example illustrated below, a recommender system delivering a 1% lift is driving more sales value than the ad targeting application delivering an 18% lift.
Not every team will be able to directly measure this value, especially those that are more foundational to the platform. In these cases, impact metrics will often be tied to capabilities they’ve enabled for other teams.

Data platform scorecard
In addition to guiding the work of the team, summarizing the impact of your data platform at the right altitude to executive stakeholders will set the tone for where you are on your journey, including where you should increase investment and where you might need an overhaul.
Roll up this measurement into initiatives that can be easily communicated to the C-suite, such as machine learning, data democratization, and data quality.
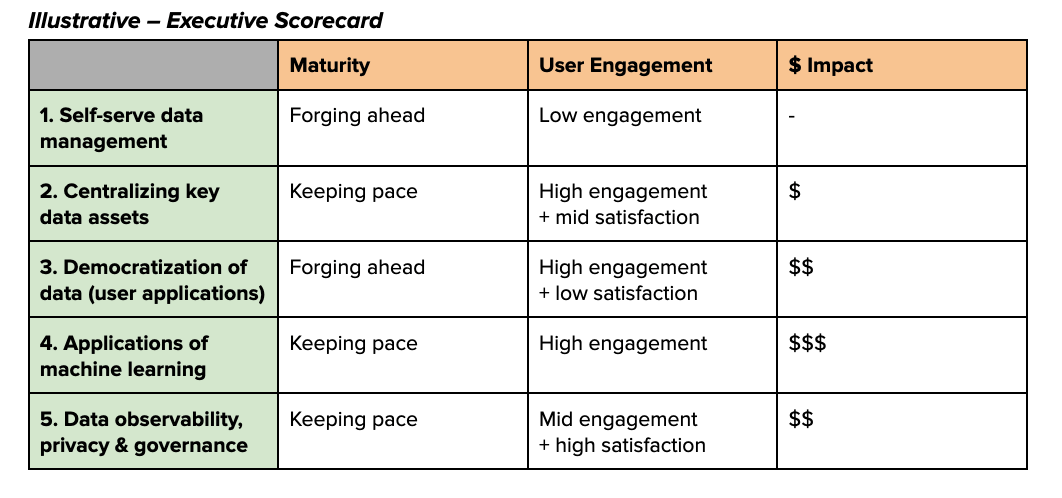
An executive scorecard will ensure you have a shared view on the data platform, showing your team’s progress quarter-over-quarter, and helping you communicate areas of opportunity and investment for your data team.
Executives will start seeing the data platform as whole rather than a collection of independent projects – allowing you to tie investments in infrastructure, governance and observability, to the data democratization initiatives and machine learning applications.
Interested in learning what it takes to build a more reliable data platform? Reach out to Shane and book a time to speak with us in the form below.
Our promise: we will show you the product.
 Product demo.
  3 Steps to AI-Ready Data
  What is a data mesh--and how not to mesh it up
  The ULTIMATE Guide To Data Lineage


