Monitoring The Six Dimensions of Data Quality With Monte Carlo

How do you know if data is fit for use?
While it will vary a bit depending on the use case, there are six dimensions of data quality that have become a standard best practice for this type of evaluation.
Let’s take a look at each of these dimensions and see how any member of the data team can deploy a relevant monitor using the extensible Monte Carlo data observability platform.
Table of Contents
Timeliness
What it is: How up-to-date the data is at time of consumption. Stale data can result in business issues.
Example incident: The data source drops a column of data changing the schema. Queries built to execute on that column break, preventing data from traveling downstream.
Monitoring with Monte Carlo:
- Automated Freshness ML Monitor Via Data Products: To detect general anomalies in load cadence, select the data product (for example a key dashboard) and automatically deploy freshness, volume, and schema monitors for all tables upstream of it as they are created with dynamic thresholds.
- Freshness Rule Via Data Validation Monitors: Perfect for situations where data must arrive at a certain time, for example Monday at 7:00 am EST or within the last 7 days.
Completeness
What it is: Do you have all the data you should? When data is missing it can skew key metrics and ML models. This could be missing field values (NULLs), entire rows (volume), an entire source or more.
Example incident: The pipeline/connector from LinkedIn to your modern data platform failed resulting in no data in your raw landing table and NULLs in your aggregated gold tables downstream.
Monitoring with Monte Carlo:
- Automated Volume ML Monitor Via Data Products: To detect general anomalies in the number of rows received, select the data product (for example a key dashboard) and automatically deploy freshness, volume, and schema monitors for all tables upstream of it as they are created with dynamic thresholds.
- ML NULL Rate Monitor Via Metrics: Select key fields on important tables to monitor for a spike in NULL rates. In this case, it would likely be something like a NULL metric monitor on the digital advertising table for the column ad_source.
- ML Dimension Tracking Monitor Via Dimension Monitors: Same as above, but in this case instead of detecting NULLs in column ad_source, the monitor would detect a skew in the ratio of rows with values equaling LinkedIn compared to Facebook or Google.
- NULL and/or Volume Rule Via Validation Monitors: You can use Monte Carlo to profile and understand the typical NULL and volume rates and set hard thresholds using Validation Monitors.
Consistency
What it is: All copies of the data hold the same value and do not contradict each other.
Example incident: The sync between your transactional database and modern data platform failed resulting in two separate, conflicting “sources of truth.”
Monitoring with Monte Carlo: In these scenarios, you typically want to be both deterministic and probabilistic with your monitoring. For example:
- Cross-Database Rule Via Comparison Rules: A deterministic approach would dictate a rule that your landing tables in your modern platform received all the rows that loaded into your transactional database.
- Automated Volume ML Via Data Products: But what if your transactional database didn’t get all the rows it should have? This is where probabilistic monitoring with an AI volume monitor would make sense as well.
Uniqueness
What it is: Unwanted duplicated or excess data.
Example incident: A file is double dropped from S3 into the modern data platform or bad SQL code results in a full rather than incremental load. Even poor manual data entry can be a culprit.
Monitoring with Monte Carlo:
- Automated Volume ML Via Data Products: You want to know if your table normally gets 50 rows added a day and all of a sudden that becomes 500 or 500 million.
- Uniqueness ML Monitor Via Metrics: Select key fields on important tables to monitor for a drop in percent unique.
- Uniqueness Rule Via Validation Monitors: This can be helpful for scenarios where all values should be unique, for example primary keys.
Validity
What it is: Does it fit the required format or logical conditions? Does the US state value have two capital letters? Does the US state column have the value “Germany?”
Example incident: Typos made on an email address field in an online form submitted thousands of times a day.
Monitoring with Monte Carlo:
- Validity ML Monitor Via Metrics: Select key fields on important tables to monitor for a drop in values in certain formats like email address, social security number, phone number and many more.
- Segment ML Monitor Via Metrics: Select key fields to monitor the relationship between them. For example, if there is an anomaly in the order_value by account_type.
- Validity Rule Via Validation Monitors: Select key fields on important tables to alert anytime a record is not in a specific format, conditions are illogical (negative age) or when the relationship of one column to another is not correct.
- Count Distinct Via Cardinality Monitor: If you have more than 52 distinct values for the column US_state then something is amiss.
Accuracy
What it is: How well the data matches reality.
Example incident: A mistake in the SQL code IS vs IS NOT miscalculates a key metric.
Monitoring with Monte Carlo: There are too many to list. All the above monitors available out-of-the-box with Monte Carlo, as well as any data quality aspect you’d like to monitor that can be written in SQL or written in natural language and generated into SQL using our GenAI feature shown below.
Remember, detection is only half the battle
Data quality monitoring needs to be easy to deploy and scalable for all members of the data team. However, it’s important to keep in mind that detecting bad data is only part of the process.
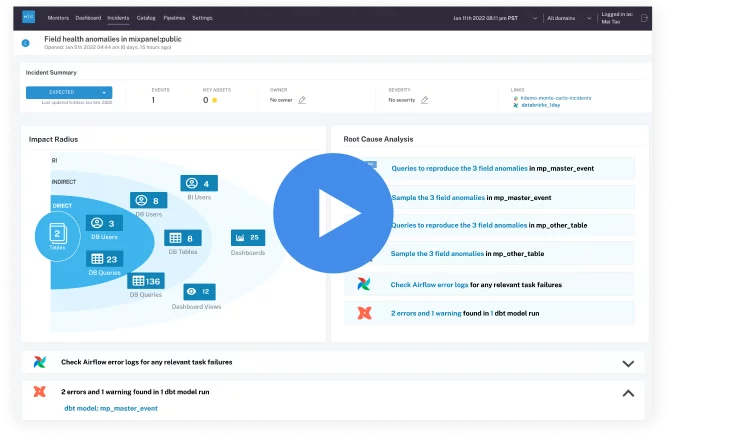
If you think about it, there is no other part of your business where you are only concerned with detecting issues without fixing them. To learn more about how Monte Carlo helps resolve data quality incidents check out our post, “How to make data anomaly resolution less cartoonish.”
To learn more about how data observability can enable your team to resolve data quality incidents, talk to the team.
Our promise: we will show you the product.
 Product demo.
  3 Steps to AI-Ready Data
  What is a data mesh--and how not to mesh it up
  The ULTIMATE Guide To Data Lineage


