Product demo.
  3 Steps to AI-Ready Data
  What is a data mesh--and how not to mesh it up
  The ULTIMATE Guide To Data Lineage
 Nasdaq’s Journey to Data Reliability with Monte Carlo

As a core technology provider to over 130 global marketplaces, 2,200 financial institutions, and over 6,000 corporations, and over 30 exchanges in North America and the Nordics, Nasdaq is one of the largest market operators in the world today.
That means that when data goes bad, the impact may well reach around the globe as well.
With millions of stakeholders in a highly regulated industry and data products feeding a web of international financial services, trustworthy data isn’t just a nice-to-have – it’s an essential component of Nasdaq’s business value.
At AWS re:Invent, Michael Weiss, AVP Product Management at Nasdaq, shared how his team turned their focus to data quality with Monte Carlo’s data observability platform. During his session, he outlined the evolution of their data journey, how they collaborate with Amazon Web Services (AWS), and some of his best practices for implementing a data quality program at global scale.
Let’s dive into some of the most critical insights from the session—and how you can leverage them to cultivate data trust in your own organization.
Table of Contents
How Nasdaq leverages data across the world
One of Nasdaq’s core technology products, their matching engine, facilitates price discovery and match buy and sell orders. Using the matching engine, marketplaces are able to provide transparent price discovery for participants and ensure orders and asset exchanges are executed timely, fairly, and orderly. That creates a lot of data that Nasdaq can use to deliver new value to both internal and external stakeholders.
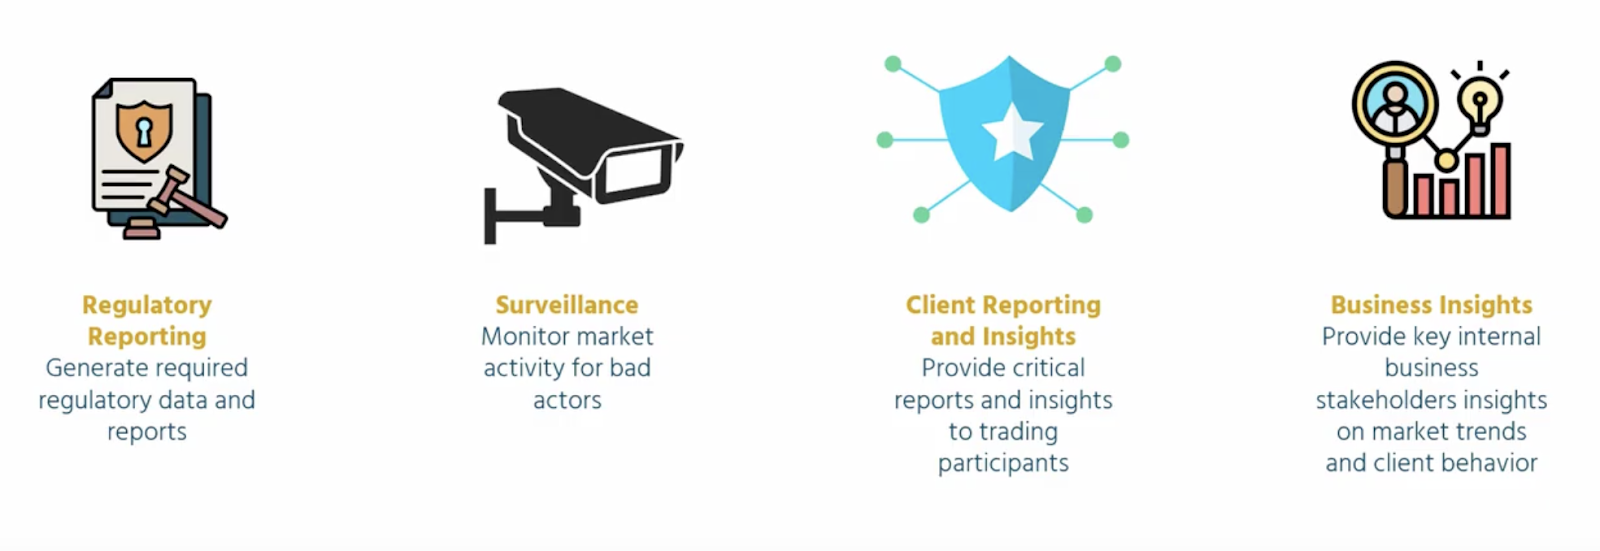
The data that’s produced as a result of the matching engine is leveraged across four key use cases: regulatory reporting, surveillance, client reporting and insights, and business insights.
Regulatory reporting
Operating in a deeply regulated industry, Nasdaq needs to be well-equipped to deliver regulatory reports at scale on a moment’s notice. “We consistently have to provide all types of insights and reporting to all types of agencies to make sure we’re in compliance,” Michael shared.
Surveillance
In addition to facilitating healthy transactions, Nasdaq uses matching engine data to monitor for what shouldn’t be happening in the market as well.
“We need to make sure that the market is behaving correctly and in accordance with the law… If there are bad actors in the market, we need to be able to identify them quickly.”
Client reporting and insights
Matching engine data is also crucial for providing trading participants with critical market insights based on behavior and actions.
As Michael highlighted in his session, “We’re looking at the behavior of our clients to understand how we can target different segments of the market, entice new order flow, bring in different participants, and understand how we can capitalize on new market conditions to optimize our revenue and market share.”
Business insights:
Finally, Nasdaq’s matching data provides a host of insights that can be useful for internal business users as well.
“We want to get a 360 degree view of our customers,” said Michael. “We want to know: what else are they doing with Nasdaq’s offerings? We sell technology to financial institutions, so we want to know the impact of that software overall, beyond just how it’s being used for trading purposes.”
Nasdaq Intelligence Platform
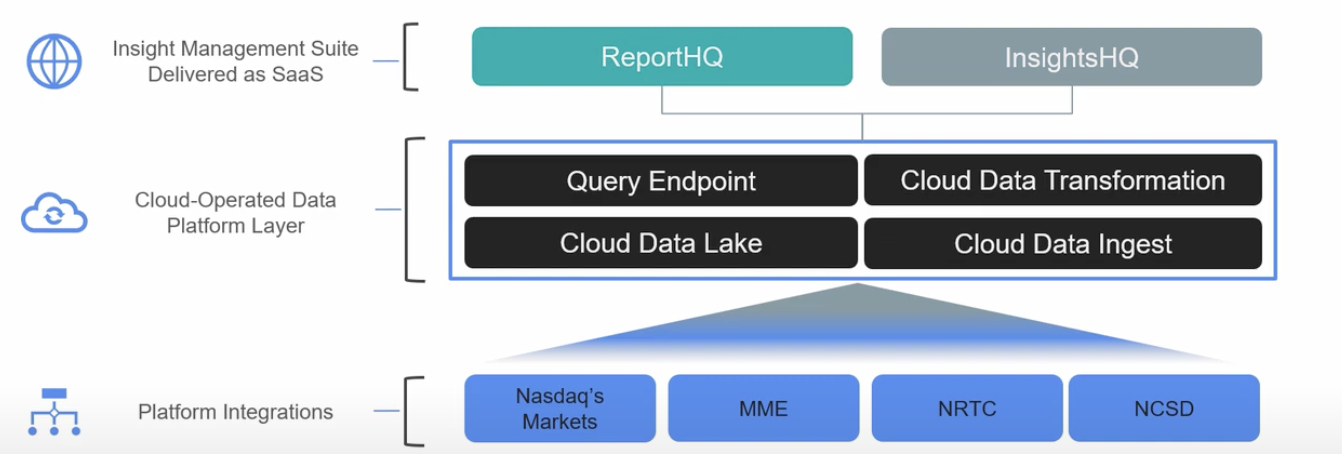
In addition to the matching engine, Nasdaq also provides customers with its proprietary market intelligence platform, Market & Peer Insight®, which they’ve operated with AWS as a cloud-native PaaS solution since 2012.
Today, the intelligence platform generates an astounding 6,000 reports per day across 35 services and 2,200 users including top trading firms. And just like Nasdaq’s other proprietary market tools, the data powering its intelligence platform has formidable SLAs to maintain.
As the Nasdaq team looks to expand Market & Peer Insight® to additional non-Nasdaq markets in production across the globe, understanding—and validating—the health of its requisite data is a non-negotiable.
Data management and monetization challenges
With so many use cases across Nasdaq’s domains, it’s paramount that the data be reliable at every level—from source to production to usage.
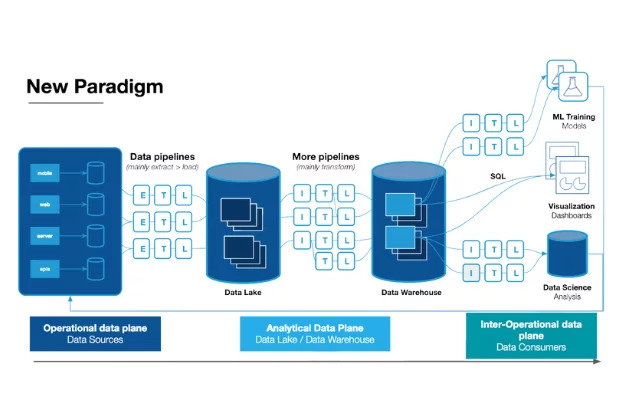
“For many of us who work in data, when we think about the modernization of the data platform, we start at the lowest level,” said Michael. “Our data lake, data warehouse, how we’re storing data, how we’re ingesting data, and so on. But in doing so, we often overlook the business needs. Like, how are the business users going to access that data? How are they going to monetize that data?”
And, at the core of all of these challenges, Michael said there’s an even more foundational question: “How are they going to trust that data?”
“Even if you have access to all of the information in your entire data ecosystem, if you can’t trust the data, then it’s no good,” he said. “For us, that’s where data observability platform Monte Carlo comes in.”
How Monte Carlo supports Nasdaq’s data architecture
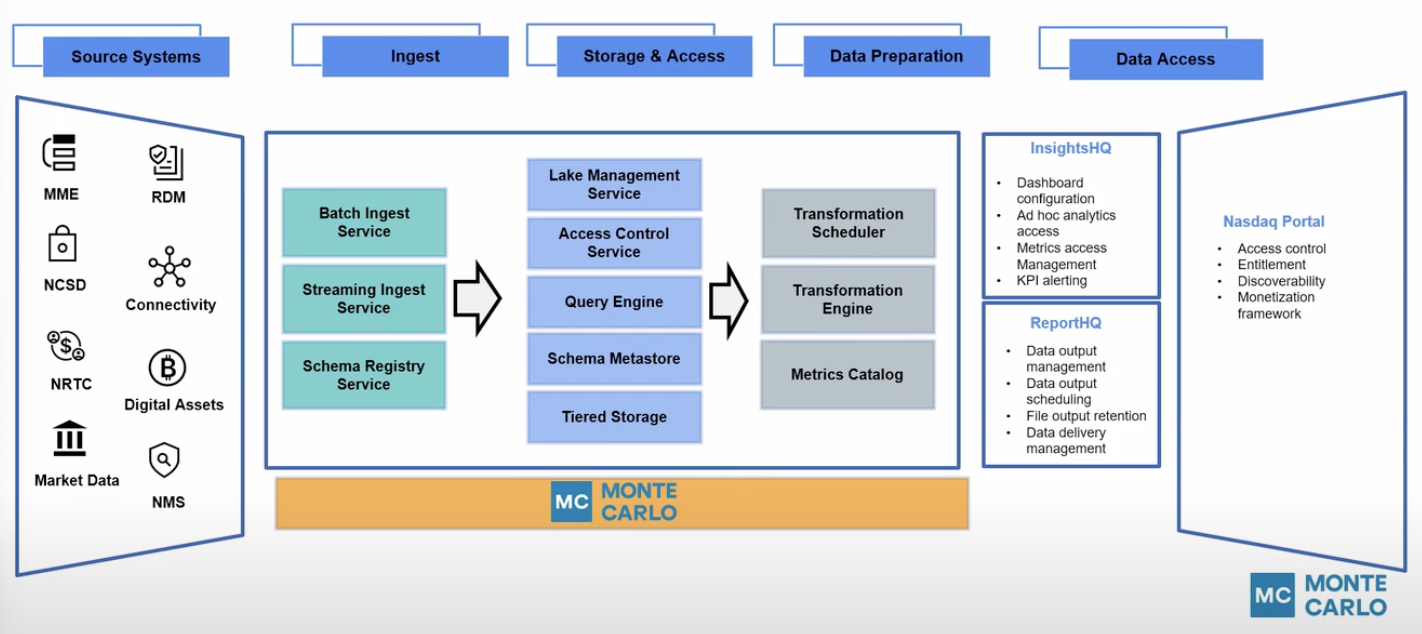
Nasdaq’s data stack operates with a traditional data lake set up and a central ingestion account where all of the Nasdaq market information arrives in one S3 bucket. From there, teams can use their own query tools to access the data.
Monte Carlo monitors the entire data lake via a multi-step deployment.
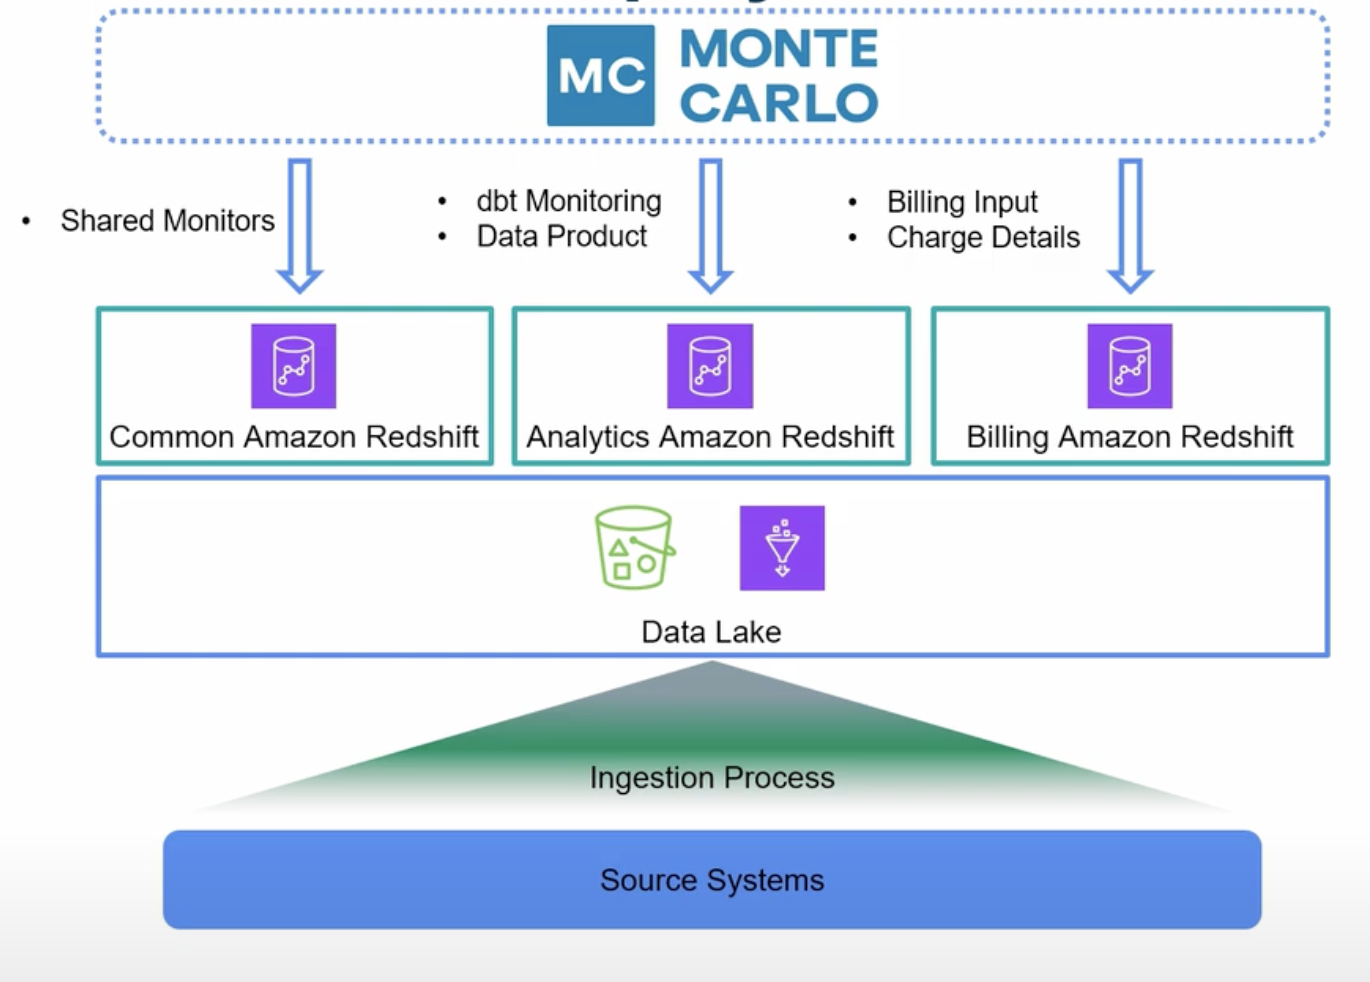
Shared monitors in their common Redshift endpoint, like out-of-the-box monitors for schema and volume changes, ensure data is loading correctly. Custom, application-specific monitors ensure specific dbt jobs are running and dbt models are producing the expected metrics in their Analytics endpoint. And monitors for their Billing endpoint identify anomalies in critical financial datasets, including revenue collection, billing, and regulatory data.
How Nasdaq operationalizes data observability
Once a data quality issue is detected, the Nasdaq data team leverages Monte Carlo to power a common incident management workflow.
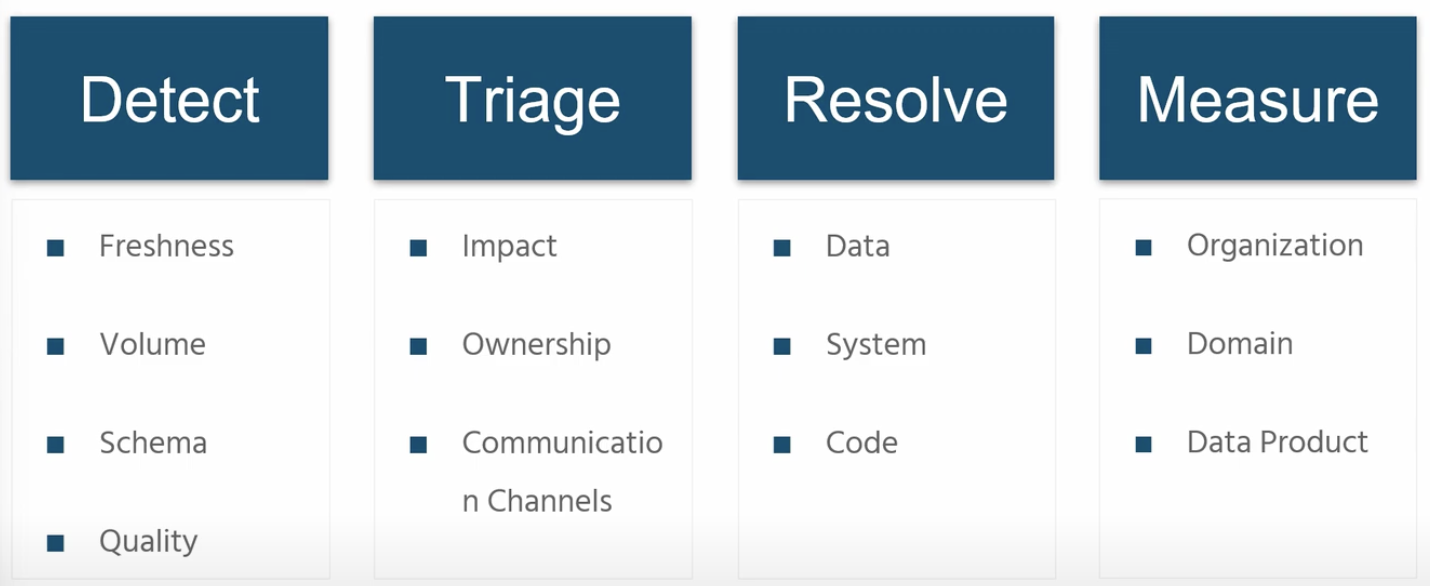
Below is a breakdown of Nasdaq’s workflow from detection to retrospective.
- Step 1. Detect data issues, typically in freshness, volume, schema, and quality changes. (There are two types of monitors that typically provide visibility into data health at different levels: baseline rules and business rules.)
- Step 2. Triage alerts by determining the impact and ownership and establishing clear communication channels to acknowledge and update on progress.
- Step 3. Resolve issues in the data, systems, or code, by reviewing operations metrics and root cause insights to understand what’s been impacted and communicate what you know to the relevant owner.
- Measure results via a retrospective process by organization, domain, and data product.
Just because a data quality issue is complex doesn’t mean the incident management process needs to be. This simple and clear process has enabled the Nasdaq team to operationalize and scale their data quality program across domains.
“We can detect, resolve, and prevent issues much quicker than we could previously,” said Michael.
So, what kinds of data issues does Monte Carlo help the team prevent? Here’s one common example from Michael:
“Let’s say the business user comes in, looks at the dashboard, and sees the month-to-date revenue looks wrong. Maybe the dashboard numbers don’t match the numbers they have from the accounting team,” said Michael. “So, we start asking questions, like: Is the data up-to-date? Did something change? Is there an error in the field health? If you don’t have the right tools, like Monte Carlo, then it’s hard to answer these questions.”
Monte Carlo’s data observability platform has enabled Michael and his team to catch several critical data issues before they impacted downstream users—like late and inaccurate data in two options markets during intraday data loading.
“We were able to resolve [these issues] that day instead of the next day when billing was going to occur,” said Michael “That saved us roughly 8 hours of development time that would have gone towards reprocessing that data.”
Other examples include issues like identifying duplicate data in a critical billing dataset and detecting a breaking schema change in a critical source system.
In all of these examples, the team was empowered to drastically reduce the time to detect and resolve issues in critical datasets—and recover hours of critical engineering time in the process.
Understanding the business impact of reliable data
Of course, the power of data observability goes beyond the ability to detect and resolve issues faster—though that’s certainly been a massive source of value for the Nasdaq data team.
For Michael and his team in particular, the ability to understand and articulate the business impact of reliable data is one of the greatest benefits of operationalizing a data observability tool.
“Data observability enables you to understand the quality of your data, data lineage, and data impact and the financial cost of your data being down.”
Getting a single pane of glass to understand the health of their data systems and their data health’s impact on the business has become a massive differentiator for the Nasdaq data team.
Michael’s advice to data teams just getting started with data quality management and data observability? Start with data quality, and then scale with data observability.
“Start with basic testing of data to understand the shape and consistency. Data observability will separate itself by doing this for you over time. Data in the wild doesn’t stay static, and what you’re doing today may not be relevant in six months. That’s where data observability really shines, because it provides the mechanism to understand what your data is doing over time.”
Want to learn more about how your financial services organization can leverage data observability to drive trust? Let’s talk!
Our promise: we will show you the product.
Read more posts.