One SLA at a Time: Our Data Quality Journey at Red Digital

Our data quality journey was a step-by-step process made possible by open communication.
We don’t run a marathon without weeks of training, but it can often be tempting to go full speed into a robust data quality program before you’ve built up the organizational muscles.
That is perhaps the biggest lesson I’ve learned on Red Digital’s data quality journey at Red Ventures: develop your program organically and iteratively. Also, create a continuous feedback loop with your business stakeholders.
These strategies were at the heart of our initiative to implement data SLAs, which are service level agreements between our data team and the business specifying the level of performance they can expect from our data systems and the responsiveness they can expect from our team.
Here, you will find our story about how we moved from reactive fire drills and informal conversations to proactive monitoring, coordinated incident triage, and codified KPIs.
Data quality is mission critical to Red Ventures
Red Ventures (RV) is home to a wide portfolio of growing businesses and trusted brands, including advertising agency Red Digital, that provide expert advice at scale. RV publishes more than 130,000 pieces of content per year, receives 750 million+ unique website visitors globally per month, and employs more than 4,500 people across 5 continents.
Good data is essential to our mission at Red Digital. We leverage AI-driven digital marketing, world class intelligence/analytics, and proprietary data from our content network to help our clients attract and acquire their most valuable customers.
This means quite a few different data stacks and infrastructures. It also means data must be delivered accurately and on time because it impacts revenue.
We are a sophisticated and high performing data team, but we have faced many challenges with bad data common across the industry.
For example, a considerable amount of time was spent chasing down one-off requests. Things like, “this report doesn’t look fresh,” or “this number looks off.” For some teams, more than 50% of all requests were some variant of a data quality or investigation issue.

Those requests from a client could trigger a 2 to 3 hour expedition for an engineer to hunt down the origin of the problem. And, unfortunately, the engineers that were the best at finding these issues then became inundated with these types of questions.
We needed to find a way out of this hedonic treadmill and endless loop of time being taken away from productive people.
You can only improve what you can measure
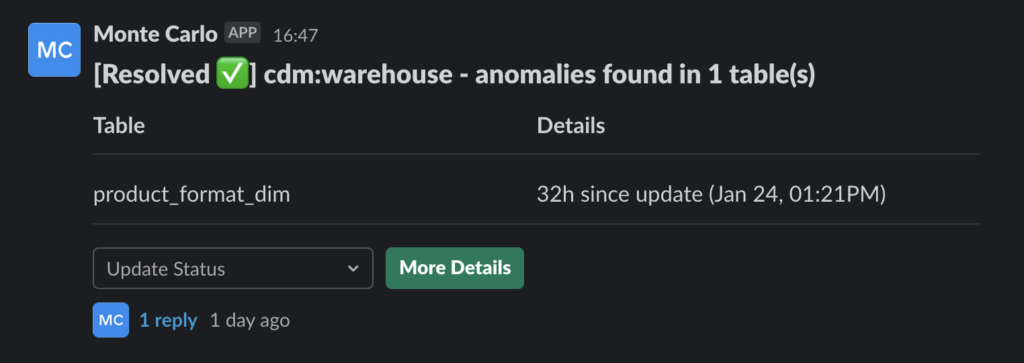
We implemented Monte Carlo in October 2021 so when data goes bad–a table breaks, data shifts abruptly or some other reason–a monitor lets us know.
The next layer is measuring performance. How well are the systems performing? If there are tons of issues, then maybe we aren’t building our system in an effective way.
Or, it could tell us where to optimize our time and resources. Maybe 6 of our 7 warehouses are running smoothly, so let’s take a closer look at the one that isn’t.

Having a record also evolved the evaluations of our data team from a feeling, “I feel the team is/isn’t doing well,” to something more evidence-based.
Talking to business stakeholders in their language
I meet with every business team in a weekly cadence, and found alerts were a great place to start the SLA conversation.
I’ve actually never used the term “SLA” in these discussions. We started with a process of reviewing and responding to each anomaly. We then moved to proactively building rules to prevent the issue from recurring.
At this point, teams became familiar enough with the process that we could start diving deep into discussions around data quality and how it impacted their day to day.
I would always frame the conversation in simple business terms and focus on the “who, what, when, where, and why.” I’d especially ask questions probing the constraints on data freshness, which I’ve found to be particularly important to business stakeholders.
I’d ask:
- How do you use this table?
- When do you look at this data? When do you report this data? Does this data need to be up to the minute, hourly, daily?
- What purpose does this serve?
- Who needs to get notified if this data is delayed?
I would also push back if I was told the data was important but no one could tell me how it was used. Conversations became more sophisticated and I would even get descriptions that could quickly transform into a query like, “no null values in this column.”
A data SLA template
As you can see, the SLA creation process was very conversational and organic. This allowed us to evolve without becoming overwhelmed, but at the same time it was important to create and write a structure so we could scale as a team.
Here is a template I’ve used and I encourage you to leverage it should you find it useful.
| Data SLA Template |
|---|
Why do you want this SLA? What is the business need? Why does this SLA (Service Level Agreement) need to exist? Provide a brief description of the business need for this SLA. |
Where is the data? Where are the specific data assets that are relevant to this SLA? List the tables, views or reports that are the most relevant to this SLA |
What are the expectations for the data? What do we need to check for? Describe the qualitative and quantitative attributes of the data we are checking for. |
When does the data need to meet the expectations? When does this become relevant? What specific deadlines matter for this SLA? Describe the days and times where the data needs to meet your expectations. Is it a recurring need? |
Who is affected? Who needs to be notified if the expectations are not met? Identify the specific teams and people that need to be informed, or who needs to take action. |
How will the team know if the SLA is met? How will the team identify if the expectations are not met? Specifically describe the mechanism for monitoring this SLA. Is there a way to automate this? |
How should the team respond if the expectations for data are not met? When an SLA is not met, what actions need to be taken? By whom? By when? Describe the actions that need to be taken when this action isn’t met. |
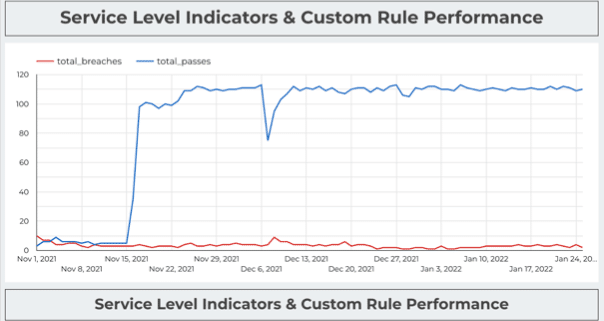
With these data SLAs in place, I created a dashboard by business and by warehouse to understand what percentage of SLAs were being met on a daily basis.
As someone with a data background, I want to know what contracts we have made as a team and where we are falling down on the job.
Engagement is a sign of ownership
From a broader perspective, understanding how often we are meeting our data SLAs helps us understand where to focus and how to pair teams with the data warehouses we support.
Designating people to take ownership of specific data assets has had a tremendous impact. It’s a matter of finding the people on the business and on the data side that understand both the importance of data quality and the business impact of delays or issues.

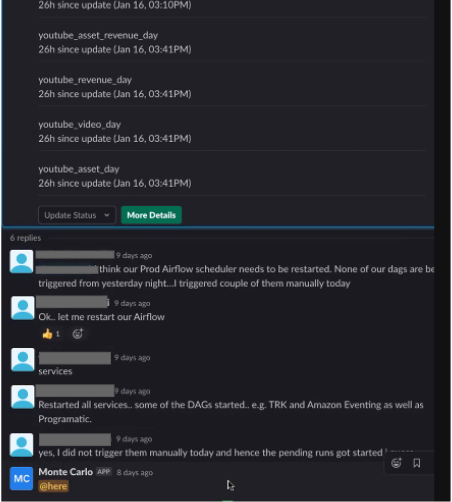
It is a key indicator if I see people engaging and resolving the alerts in Slack. We are seeing more and more engagement, which is a great sign our program is going in the right direction.
Data trust is still a work in progress, but we’re on the right path
It’s important for SLAs to incorporate how a team should respond. All of our SLAs contain which team will be responsible when an issue arises as well as how they will communicate outages and progress.
We are still working on optimizing and dialing in the escalation piece. We are also not at the point yet where we are ready to consider a full data certification program to start tagging tables covered by our SLAs.
But, we have made tremendous progress. Progress I can socialize with every business stakeholder–after all I have the SLA dashboards to prove it.
Interested in learning how your data team can set SLAs for your data system? Book a time to speak with us in the form below.
Our promise: we will show you the product.
 Product demo.
  3 Steps to AI-Ready Data
  What is a data mesh--and how not to mesh it up
  The ULTIMATE Guide To Data Lineage


