Product demo.
  3 Steps to AI-Ready Data
  What is a data mesh--and how not to mesh it up
  The ULTIMATE Guide To Data Lineage
 The Real Impact of Bad Data on Your AI Models

By now, most data leaders know that developing useful AI applications takes more than RAG pipelines and fine-tuned models — it takes accurate, reliable, AI-ready data that you can trust in real-time. To borrow a well-worn idiom, when you put garbage data into your AI model, you get garbage results out of it.
Of course, some level of data quality issues is an inevitability…so, how bad is “bad” when it comes to data feeding your AI and ML models? And more importantly — how can you know when your data quality has deteriorated enough to actually impact your business?
That’s exactly what data leaders and researchers Andrew Koller and Chris Bosley of SF Data Partners set out to discover. After running over 100,000 simulations polluting data in various ways, they learned that AI models can actually tolerate some data being a little messier — the trick is knowing which data it can tolerate, what that tolerance is, and how to monitor the rest of your data effectively.
Read on to learn more about Koller and Bosley’s experiment, what data teams can learn from their findings, and the best practices you need to know to implement smarter data quality monitoring for critical pipelines — AI or otherwise.
Table of Contents
The Problem with Data Quality & AI
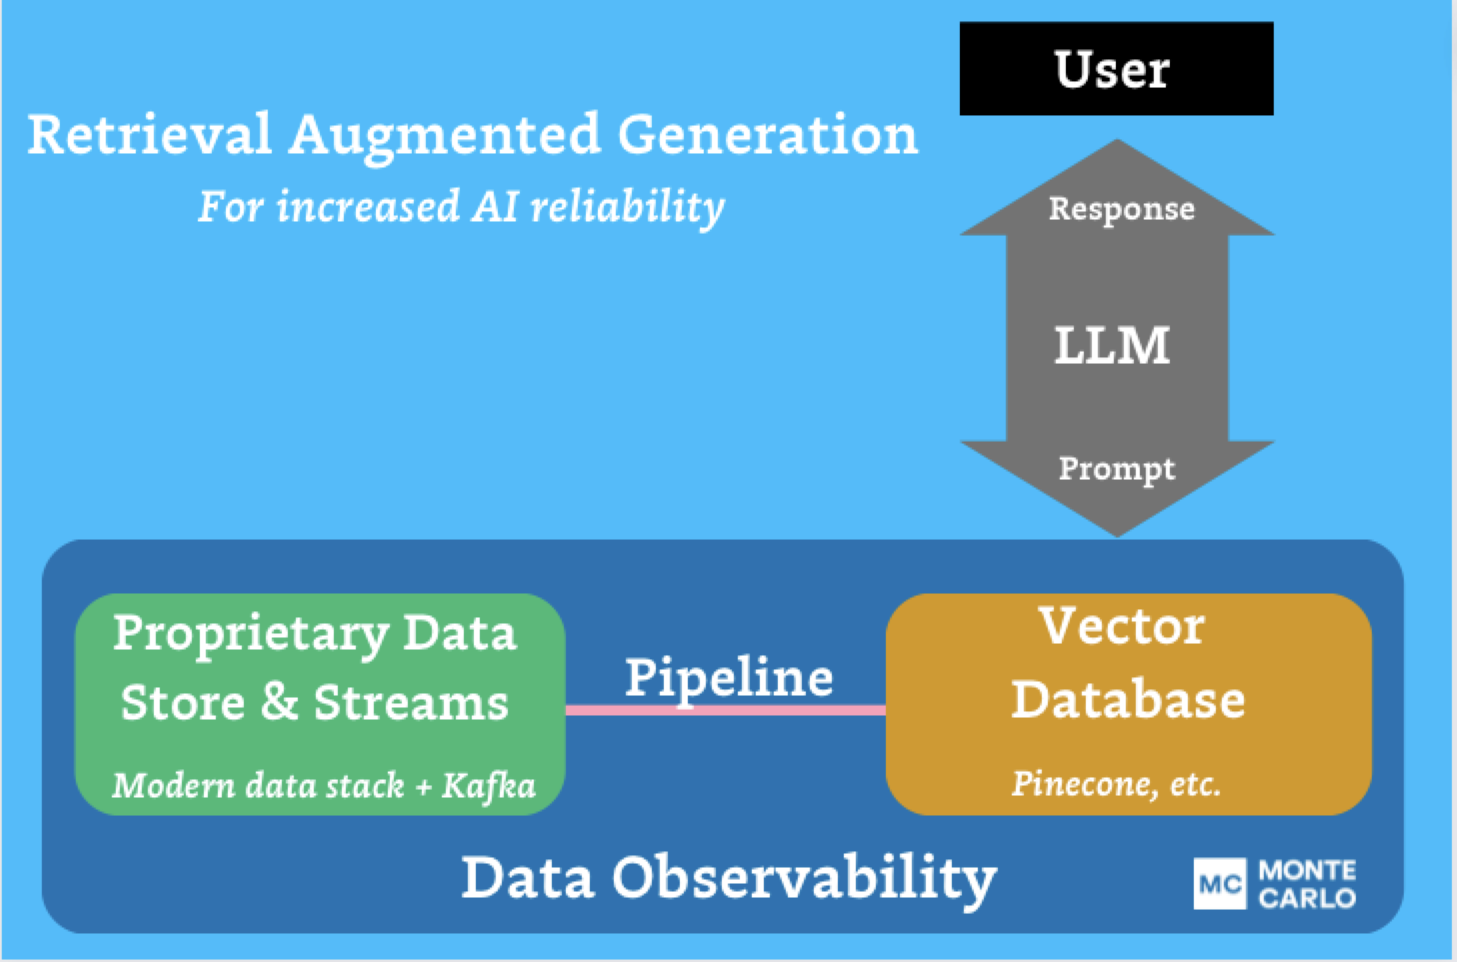
If you haven’t heard already (and of course you have), GenAI is a data product. Much like traditional machine learning, modern artificial intelligence relies on curated datasets—generally semi-structured, event-based data—to generate responses for internal and external stakeholders.
And just like traditional ML, when it comes to GenAI, garbage in still means garbage out. Unfortunately, at the scale of AI’s data consumption, data quality is unpredictable at best.
The question is—is all bad data the same?
That’s what Koller and Bosley wanted to find out.
Designing an Experiment: How Much Bad Data Can AI Handle?
While concerns about data quality are prevalent among ML practitioners, the actual impact of bad data on model performance has remained largely unexplored. Unfortunately, because most enterprise data teams try to avoid the consequences of bad data at all costs, finding enough historic incidents to analyze and compare is dubious at best.
Instead of looking backwards to answer their question, Koller and Bosley decided to design an experiment that could simulate common data quality issues at scale—like missing values, noise, and feature transposition—and then systematically measure the results of those issues on model responses. Here’s how they did it.
Methodology
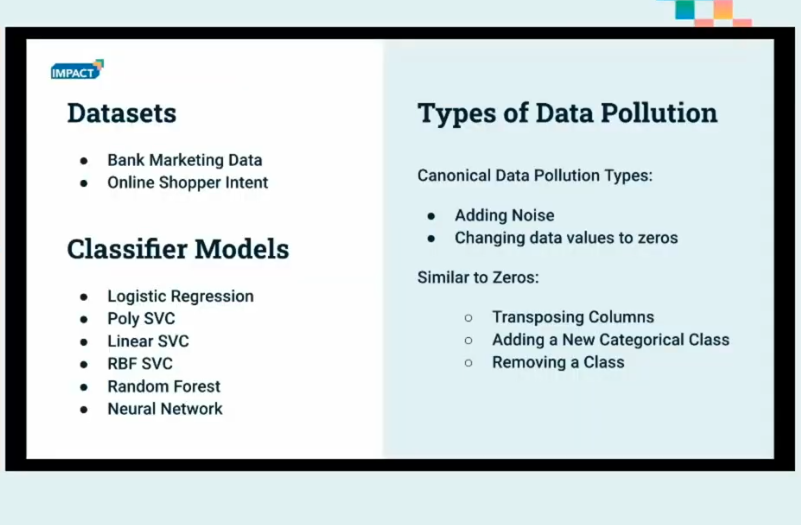
An experiment is only useful insofar as it reflects reality. To make sure they were measuring real world impacts, Koller and Bosley selected two publicly available datasets characterized by large volumes and imbalanced classifications, reflective of real-world scenarios where classification algorithms often need to detect rare events such as fraud, purchasing intent, or toxic behavior.
Bank Marketing Data Set: Data collected from a Portuguese marketing campaign related to bank deposit subscriptions for 45,211 clients and 20 features, with an output response of whether an individual subscribed to a term deposit.
Online Shopper Intent: A collection of feature vectors belonging to 12,330 sessions each with 18 features, with an output response of whether the session ended with shopping.
Once they had their data in place, the pair ran it through six common classifier models, covering everything from logistic regression to neural networks. Then came the fun part—poisoning the well.
To simulate common real-world data quality issues, Koller and Bosley introduced the following pollutants:
- Changing data values to zeros: This simulates scenarios where nulls or unknown values are replaced with zeros during runtime—a common data cleaning technique.
- Transposing Columns: Simulates errors where two feature columns are mistakenly switched, often due to bugs or data entry mistakes.
- Adding a New Categorical Class: Randomly changes entries in a specified categorical column to a new, unseen category, reflecting scenarios where new data categories are introduced without updating the model.
- Removing a Class: Simulates the removal of an entire class from the data, which can occur due to incomplete data capture or processing errors.
- Adding Noise: Introduces random noise to feature values to mimic the impact of data corruption or sensor inaccuracies.
During experimentation, they discovered that three of these five methods actually resulted in zeroing out their values. This led the pair to ultimately identify just two canonical forms of data pollution: adding noise (random incorrect values) and changing values to zeros (simulating data loss).
Finally, to measure accuracy, the team employed the use of F1 scores. F1 measurement excels in situations where precision and recall are crucial and provides a balanced view of a model’s performance, especially in the presence of class imbalance—as seen in both datasets.
Consider a fraud detection system for a large e-commerce platform. In this scenario, the F1 score is crucial because it balances precision and recall. Precision focuses on minimizing false positives—in this case reducing the number of legitimate transactions flagged as fraudulent—while recall aims to catch as many fraudulent transactions as possible. False positives can lead to dissatisfied customers and lost sales, while false negatives would result in financial losses due to undetected fraud. The F1 score provides a single metric that captures both these aspects, making it ideal for evaluating the model’s overall effectiveness.
“F1 is a measure that balances both false negatives and false positives,” Koller says. “We ran over a hundred thousand simulations of data pollution, systematically taking our test data sets and polluting them from a perfect data set for each feature down to complete trash.”
Testing their hypothesis
Based on their sample data, the pair set up a variety of experiments to test the tolerance of AI to data quality variables.
In this example of their banking data, the pair tested their AI model’s ability to predict the future success of a marketing campaign to promote term deposit subscriptions. Koller and Bosley knew an inaccurate response would impact the business in one of two predictable ways:
- False negative: Someone signed up who the bank wasn’t marketing to
- False positive: The bank actively marketed to someone who didn’t accept the offer
The team then calculated when these prediction errors became expensive enough to warrant action:
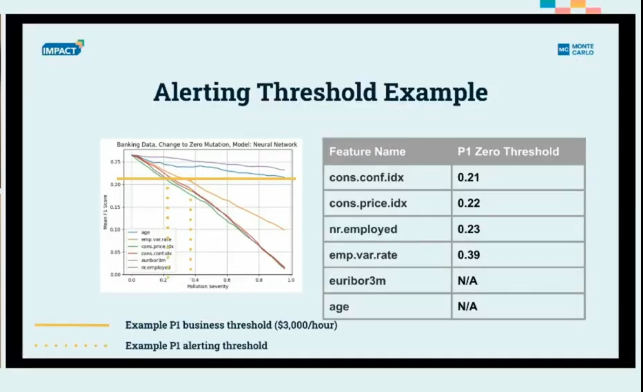
- P1 alerts (business hours): When bad data caused $3,000/hour in impact, it would be worth having an engineer prioritize identifying and remediating the issue during normal business hours.
- P0 alerts (wake-up calls): When costs hit $5,000/hour, it was worth waking someone up outside of business hours to resolve the issue immediately.
Findings
So, what did Koller and Bosley discover? In short, different models exhibit different sensitivities to data pollution.
In the case of their marketing example, employment data needed strict monitoring to deliver reliable results, but age data could see up to 65% noise pollution before significantly impacting accuracy.
As Koller says, “What’s interesting is the different slopes — and that’s what helps us determine where to set our monitoring thresholds.”
The most significant impacts were observed from complete data loss or the introduction of random noise that could be introduced by anything from typing errors to sensor inaccuracies.
These findings highlight the necessity for practitioners to understand the complex relationship between their machine learning and AI models and the critical data that powers them—and then create the appropriate data quality coverage and incident management processes to mitigate risks.
From Theory to Action: Key Insights
Among its various implications, Koller and Bosley’s research revealed three surprising findings about data quality’s impact on AI:
- Hidden Business Costs
“Operational data quality as it relates to ML is overlooked,” says Koller. “The impact just isn’t really understood very well, in our experience.”
According to Koller, many teams underestimate how data quality issues cascade into model performance and ultimately, business outcomes. However, by understanding which columns and datasets have the most significant impact on model accuracy, practitioners can prioritize their data quality strategy for impact.
- Models Vary in Sensitivity
Different models respond to different kinds of data pollution in different ways.
Understanding feature sensitivities is crucial for anticipating how different types of data issues might impact the model—and preparing appropriate responses to protect data consumers. This step is key precisely because the complex parameters of models are impossible to interpret, and all the more so in the case of generative outputs.
- Real-time Monitoring is Non-negotiable
Without continuous monitoring, models can silently degrade as data quality issues creep in, undermining the value teams expect from their AI investments.
“Real-time quality monitoring is essential in order to get the value out of the models that we all expect them to have,” says Koller.
These insights underscore why data teams need clear quality thresholds tied to business impact — and why a modern, continuous, and scalable approach to quality is so critical to AI success.
Managing Data Quality for AI
Of course, managing data quality at the scale required for most AI applications is no small order. From coverage limitations to alert fatigue, the foundational requirements of AI-readiness present a variety of challenges that can easily become exacerbated at scale
So, as you consider creating a scalable data quality strategy for your AI, consider these four principles:
- Know Your Data
Start by understanding what “good” and “bad” look like for your data. What’s the business value of a particular dataset? Who owns it? And who’s responsible when things go wrong?
If you know what data matters, you know what data to monitor.
- Set Realistic Targets
Controlled environments like the one referenced in this study might afford teams the opportunity to define the perfect standards and thresholds but reality requires compromises.
At Monte Carlo, we recommend metrics like a high status update rate within the Monte Carlo platform to ensure teams are staying on top of major incidents. Marking incidents with statuses like investigating, fixed, and no action needed tracks progress and gives visibility to remote teams who might be abstracted from the day-to-day maintenance of the data.
- Keep Track of Incidents
Tracking what went wrong can help you learn from your mistakes and identify gaps in coverage for future data products. A good incident tracking strategy can also help you uncover systemic issues or areas for further data quality investment.
Modern data quality tools like data observability can also automate much of this process by proactively tracking incidents by table or data product and providing historical insights to measure against specific SLAs.
- Maintain Feedback Loops
Things change fast in data—stay alert and be ready to pivot when the time comes. For example, if your team has a high number of unclassified incidents in their dashboards, that’s a strong signal that they might have an alert fatigue problem—and once alert fatigue sets in, critical issues get missed.
Keeping a close eye on the effectiveness of your alerting and monitoring strategy with feedback loops and proactive communication is the best way to make sure your data quality practices are fit for purpose. Our advice? Keep what works, adjust what doesn’t, and remove monitors that aren’t providing value.
The Truth About Data Quality: It’s Not All or Nothing
The moral of this data quality story: there’s a complex relationship between data quality and AI performance, and not all bad data impacts model performance in the same way. That’s why you need to know your data and its thresholds — and have a strategic monitoring and alerting strategy in place to take swift action when needed.
That’s where Monte Carlo and data observability comes in. By automatically monitoring your data quality, detecting anomalies, and alerting the right people at the right time with the right insights, you can protect your models more effectively—and without the guesswork.
Our promise: we will show you the product.
Read more posts.