Vanquish Toil: 9 Data Engineering Processes Ripe For Automation

Data teams love the idea of automating data engineering processes in principle. After all, who doesn’t want to move faster and eliminate the time consuming, boring aspects of their job?
But even time-strapped, technically savvy engineers will sometimes squirm when the suggestion is made to automate a specific task. We’ve felt it ourselves.
There are often understandable reasons for this hesitation:
- An upfront investment of time and/or resources
- The change management needed to modify related processes
- Nerves tied to removing human oversight
- Pride that we can outperform the machine
- Misconceptions that automation has to be an all or nothing process
- And more.
At the same time we’ve never worked at an organization and thought, “there are too many data engineers and not enough work.” Pushing through this initial discomfort is vital for survival.
The alternative is to drown in toil, famously defined by the Google site reliability engineering handbook as, “the kind of work tied to running a production service that tends to be manual, repetitive, automatable, tactical, devoid of enduring value, and that scales linearly as a service grows.”
In this spirit, we got together to brainstorm nine data engineering processes we believe are ripe for automation. Some are proven best practices, some are solved by vendor solutions, and some we haven’t quite yet solved ourselves.
Table of Contents
- Ad hoc analysis
- Hard coding pipelines
- Moving across environments from staging to production
- Unit testing and Airflow checks
- Root cause analysis
- Data documentation, cataloging, and/or discovery
- Data clean up
- Data Wrangling
- Renewing Authentications and Permissions
Ad hoc analysis

The executive has a one-off question for you. It’s casually asked, but somehow also urgent.
“Hey Mauricio, I’m curious what our North America customer churn rate is in our enterprise segment, could you look that up for me really quick?” You do a little SQL, a few joins, and after some time, you export into Excel and ship off the answer.
Except, now you are being pinged separately by another executive on the same topic because this issue was discussed at an important meeting earlier in the day. This executive wants to know the churn rate in terms of net dollar retention.
It’s a few minutes of your time and may cause some confusion down the road, but that’s not your problem. You ship that answer off too.
Next week you get asked all sorts of ad-hoc questions about customer retention metrics and you realize this very important meeting is recurring and it would have saved you time to gather requirements and generate a dashboard in a reporting tool like Looker.
Or maybe we’re the only ones who’ve experienced this?
Hard coding pipelines

There is the right tool for every job. Sometimes that may involve building complex ETL pipelines from scratch.
Most of the time it’s going to be setting up a connector to automatically ingest data from Salesforce, or some other wildly popular service, to send it to your data warehouse. For these data engineering processes, there is no need to be a code warrior.
We’ve outlined a number of automated ingestion solutions in our article on how to build a data platform that save time on both pipeline creation and maintenance. One of those vendors, Fivetran, calculates each connector takes five weeks for an engineer to build and a dedicated week of maintenance work per quarter. It’s much faster to just use an automated solution.
No one understands your raw SQL anyway.
Moving across environments from staging to production
This is a situation we faced not too long ago internally at Monte Carlo.
We have data in streams that we write to S3. To make that data available in our Snowflake environment, we needed to manually login to Snowflake and define the external table that points to the S3 data. Sometimes we …er other people… would create the stream but forget to create the table in Snowflake. Or, there would be a manual error that would break jobs. Now the Snowflake table is created automatically when the stream is created.
During the CI/CD process you want to ensure the schema works, and once it does, be able to push it to production automatically.
Unit testing and Airflow checks

Ah, who doesn’t enjoy sipping their morning coffee in the ghoulish blue light of their monitor while checking Airflow to make sure those jobs actually ran and the company’s dashboards have all refreshed? Cozy.
Unfortunately, the most delightful brew can’t offset the fact this is a pretty silly and outdated routine in the “petabyte, billions of streaming events per day” era.
It’s also breathtaking that we are still constantly writing never null and source-to-target checks as basic stopgaps to ensure data actually got where it was supposed to go (and we’ll leave it to hopes and dreams that it’s not anomalous).
Data testing is a classic problem of scale, organizations can’t possibly cover all of their pipelines end-to-end–or even have a test ready for every possible way data can go bad.
One organization we worked with had key pipelines that went directly to a few strategic customers. They monitored data quality meticulously, instrumenting more than 90 rules on each pipeline. Something broke and suddenly 500,000 rows were missing–all without triggering one of their alerts.
This is one of those data engineering processes better suited for automated, machine learning powered monitors in data observability tools. An additional automation hack for Monte Carlo customers: setting your custom monitors as code so they are automatically adding checks to your YAML files whenever you create a new table.
Root cause analysis

The classic fire drill. There is a problem with the data and we need to find that needle in the data stack now.
The first step many teams take is to frantically ping the data engineer with the most organizational knowledge and hope they’ve seen this type of issue before. The second step is to then manually spot check thousands of tables. That is painful.
Some better organized teams can accelerate their time to detection with a 5-step root cause analysis process we’ve written about previously (or something similar). At a high-level this involves:
- Paddling upstream from the broken dashboard and tracing the issue up the DAG.
- Reviewing the ETL code of the upstream table experiencing the issue.
- Reviewing the other fields in that table to see if there is a relational pattern in the anomaly that can help shed light on the issue.
- Reviewing logs and error traces from your ETL engines to answer to see if this is where the problem lies.
- Grilling your peers to see who changed what when.
There are two ways automation can greatly accelerate this arduous data engineering process. Automated end-to-end monitoring and alerts help shorten the time to detection.
It is a much shorter cognitive jump and a much quicker process for a data team to understand what has changed in their environment when a data issue is identified immediately versus it being discovered a month later by Marty in accounting.

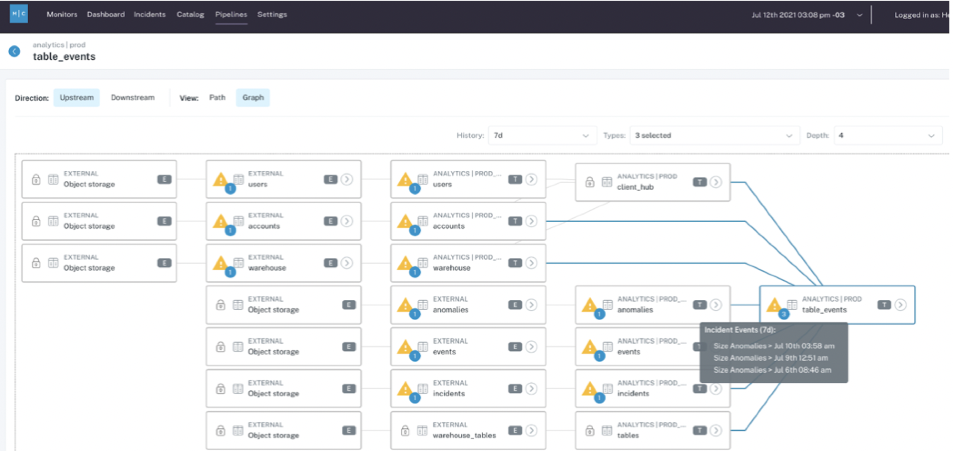
A tool with automated lineage can also save your team from manually tracing paths through SQL query logs to find the most upstream table impacted (or in reverse trying to understand what other tables are impacted by this data incident).
Inevitably every query leads to 10 more to look at and the exercise becomes the world’s worst Choose Your Own Adventure book ever written.
Data documentation, cataloging, and/or discovery
One of the next frontiers for the data stack is the semantic or descriptive layer.
We’ve made our feelings known regarding the limitations of traditional data catalogs, but whether it’s through using a catalog, data discovery, or other tool, there needs to be some sort of automated process for documenting datasets.
We now have decades of evidence to show that if data documentation isn’t automated, then it doesn’t happen–at the very least not at the necessary scale.
That’s why we have the “You’re using THAT table?!?!” problem and why we are treating data engineers like data catalogs by pinging them incessantly in Slack about which table to use.
We need more context around our data in addition to upstream and downstream lineage. Practical information like:
- Table owners, experts, frequent users
- Recent schema changes
- Reads per day, writes per day
- Is it a key asset?
- Number of users with queries executing on the table
- Deteriorating queries
Unfortunately, discussions about these critical topics don’t usually happen in a data catalog, and if they do, they’re siloed and become outdated sooner than you can say “data downtime.”
What if you could surface conversations about these critical tables directly into existing workflows and communication channels?
Data clean up

Speaking of automating data engineering processes and data discovery, it is really hard for data consumers (analysts and data scientists) to find what they need in the data storage layer.
As data engineers, we are often guilty of following the industry conventional wisdom of, “dump the data in the warehouse/lake now, figure out how to transform/use it later.” Can you blame us? Speed is so important, storage is so cheap, and data scientists are so downstream.
But at some point, the chickens come to roost and the CTO asks why the S3 bill (or Redshift, Snowflake, BigQuery, etc) is so crazy. Soon enough a data engineer is manually combing through bucket by bucket to determine what data or table is being consumed, by what process, and what can be deleted.
Automated or semi-automated information lifecycle management is not new. This problem could easily be automated by deleting data and tables that haven’t been used in X period of time–Monte Carlo even generates insights on abandoned tables in its Table Cleanup Suggestions report that could be leveraged as part of this process.
If that idea makes you squirm (us too), at least a half step can be taken where these assets are flagged for review before disposition.
Data Wrangling

Most organizations get data from a few key third-party partners.
Retail companies for example may be getting data dumps from FedEx. Most marketing departments will leverage some digital advertising aggregation and receive data from those advertising partners via a DSP-type tool.
Inevitably, the data is not clean. Each third party has their own format, they drop their files at a different frequency, and bugs are not uncommon. Standardizing and formatting these inputs is a perfect process to automation as it is the definition of routine and tedious.
Some teams start with running a script and will then upgrade and start automating with Airflow. It’s better to start sooner than later.
Renewing Authentications and Permissions
This falls into the category of, “we don’t have a solution, but something outta be done.” Simply put, configuring is a pain in the butt.
While you don’t do it every day as a data engineer, it is a very manual process. Whenever you have to connect systems together you need to find the credentials and check permissions. And it always fails the first time because there was some permission missing somewhere.
In addition, one of the biggest contributors to broken dashboards (and data freshness in general) is expired tokens. Google Analytics or Salesforce needs to be re-authenticated but no automated warning or notice was sent to anyone who could take any action. The only way you notice is when the data stops coming in and you investigate why.
It’s a silly, maddeningly common problem. Something outta be done.
Life’s Too Short For Toil
Life is too short and data is too fast for manual data engineering processes. Start your automation journey by keeping track of your time and identifying quick wins.
Keep in mind the wisdom from our friends at Google, “If a human operator needs to touch your system during normal operations, you have a bug. The definition of normal changes as your systems grow.”
Curious about other data engineering processes we can help accelerate? Connect with Glen or set up a time to chat with a Monte Carlo expert.
Our promise: we will show you the product.
 Product demo.
  What is data observability?
  What is a data mesh--and how not to mesh it up
  The ULTIMATE Guide To Data Lineage


