What is data + AI observability?
Find and fix bad data + AI—before it impacts consumers.

Why do I need it?

80% Less Data Downtime
30% Time Saved

70% More Data Quality Coverage
You need smarter data reliability
Traditional data quality is only focused on detecting anomalies. Don’t settle for what broke. Discover why, who was impacted, and how to fix it with data observability.
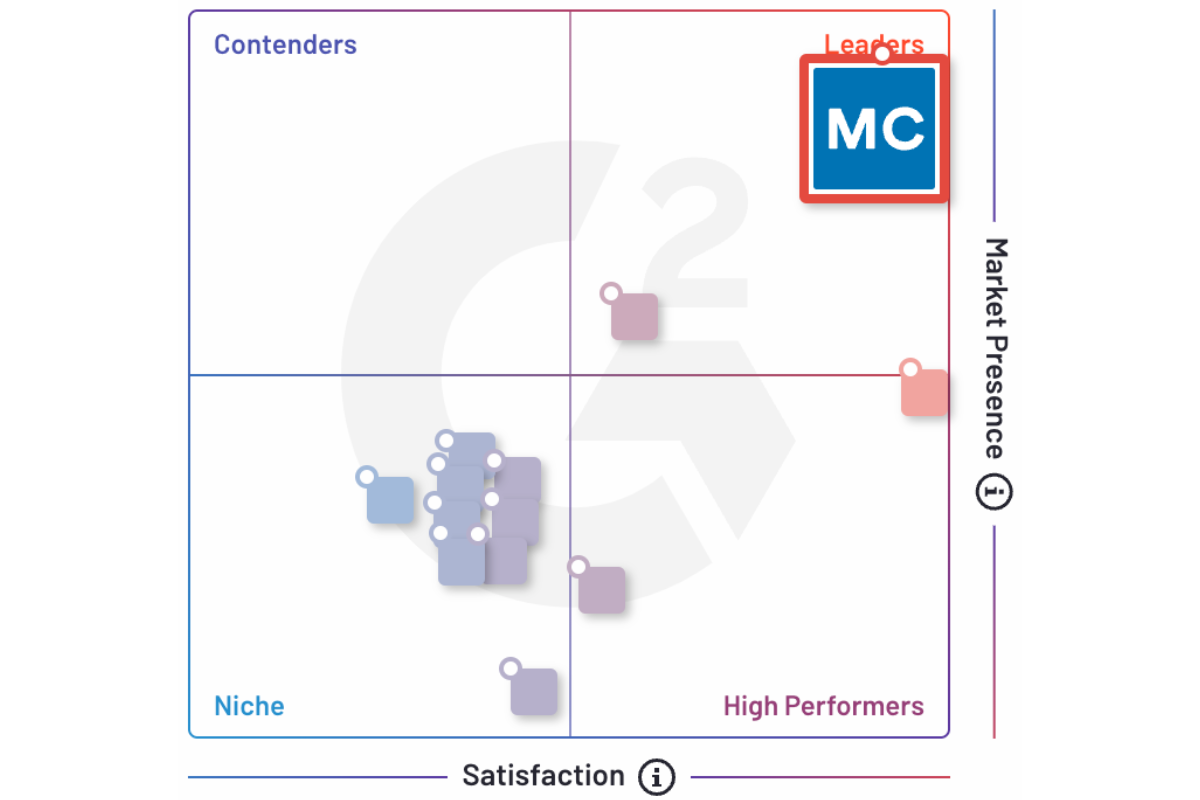
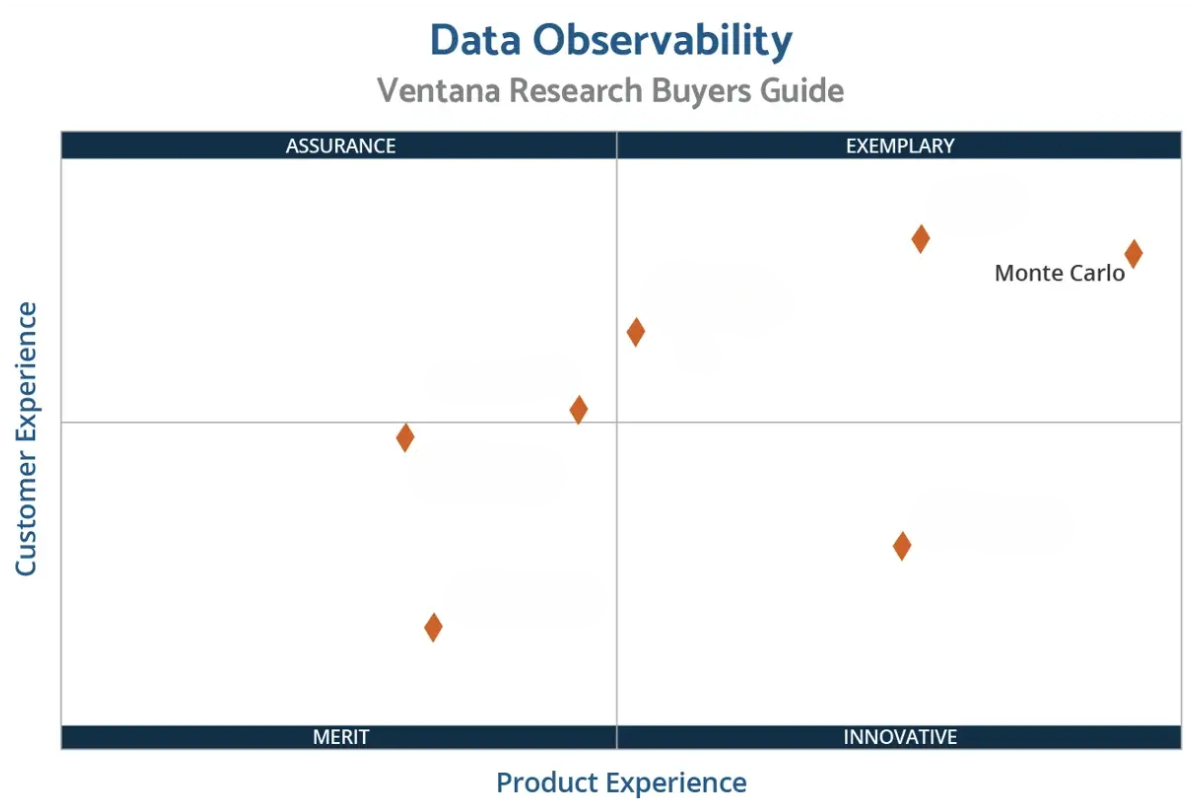
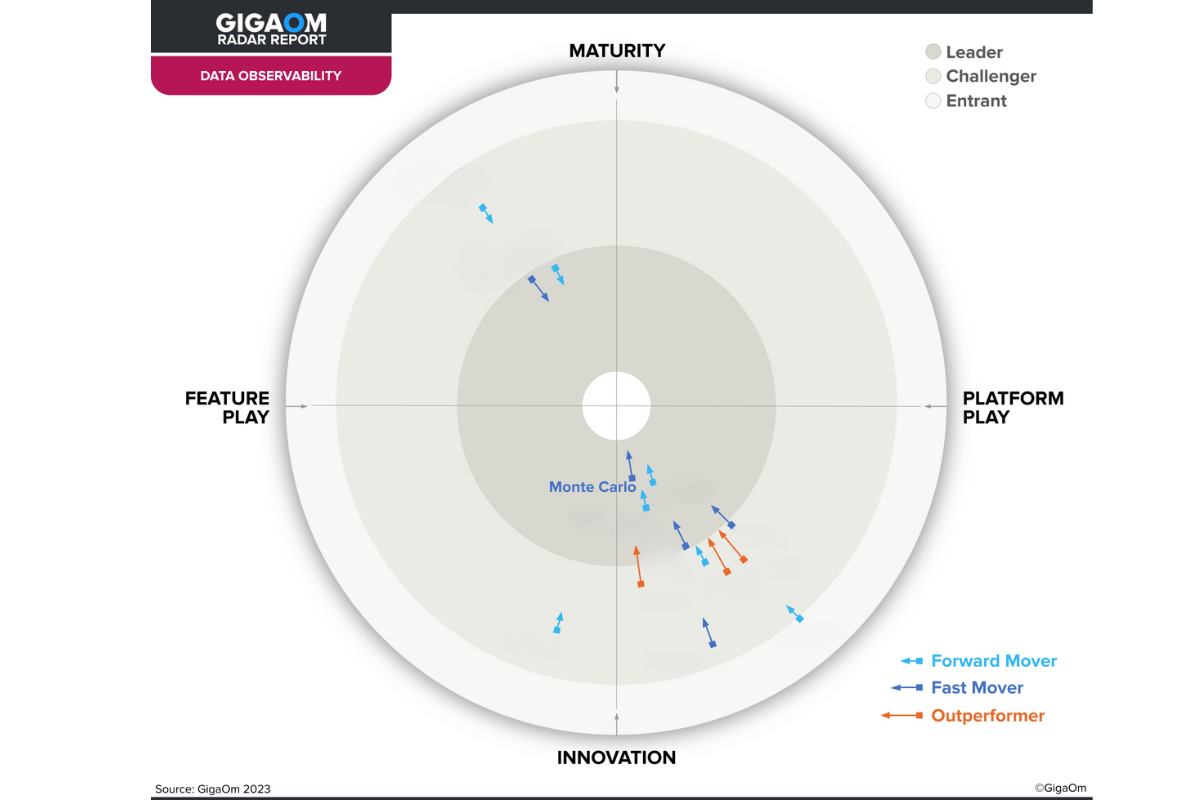
The Undisputed Leader
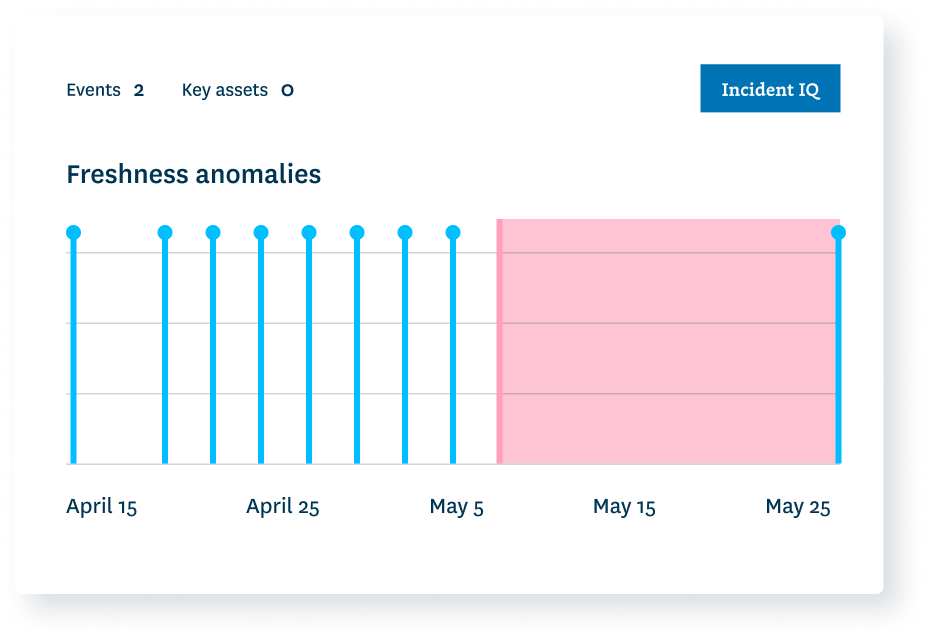
Find it
Automated machine learning monitors. No code, no guesswork, no oversights.
- Scale anomaly detection with automated monitors and AI-enabled recommendations.
- Deploy deep quality monitors with +50 metrics.
- Build custom rules for unique business logic.
- Ensure consistency across tables and databases.
Mitigate it
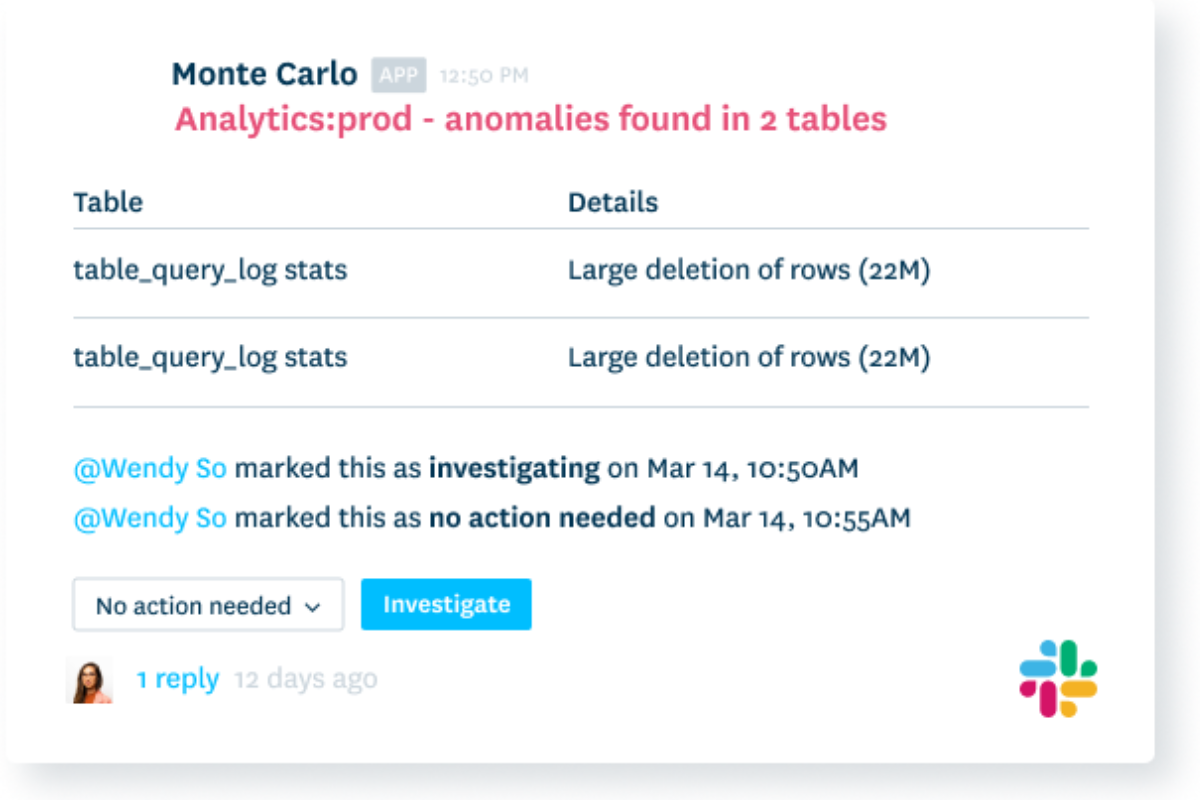
Transform your incident response from reactive scramble to proactive service.
- Enhance focus with automated impact analysis.
- Get actionable alerts to the right team.
- Track incident tickets, severity, and status.
- Display data product SLAs and health status.
Fix it
+1,000 incidents are resolved in Monte Carlo every day.
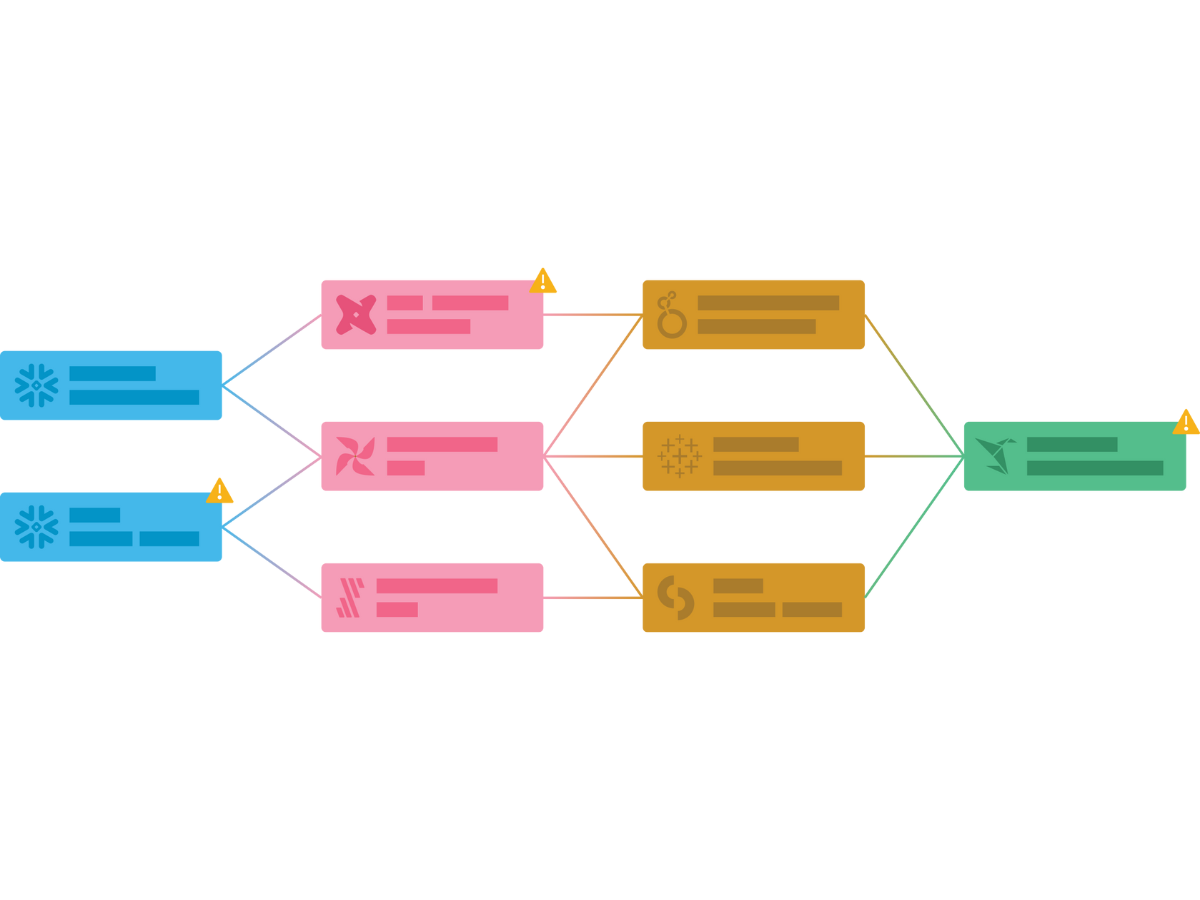
- Understand where incidents originated with cross-system data lineage.
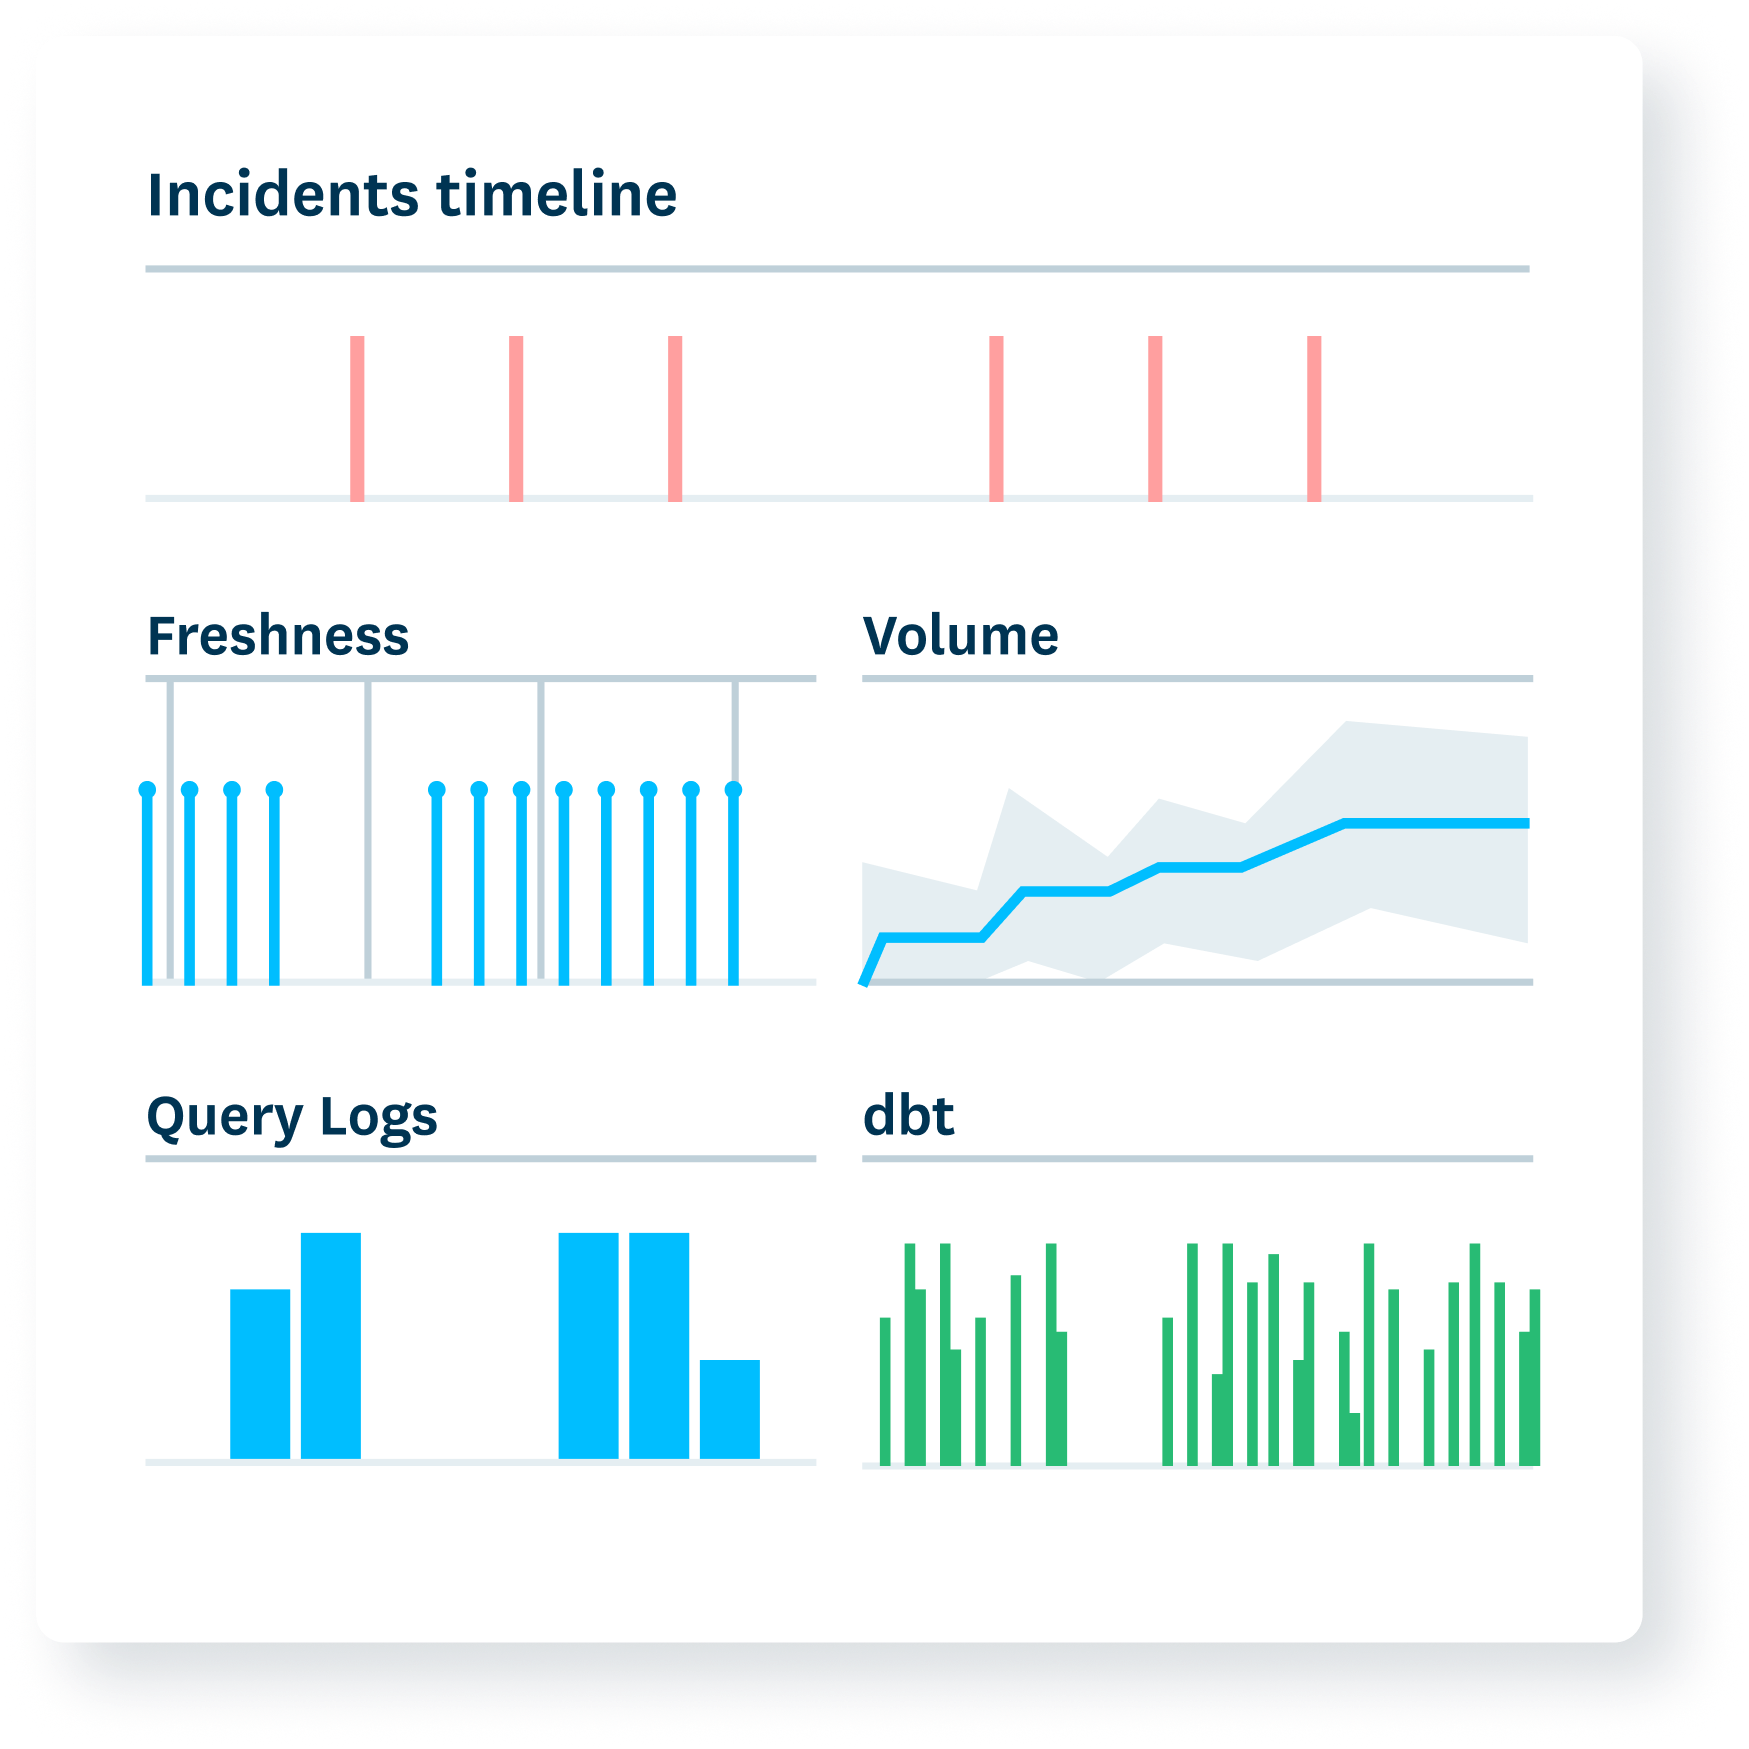
- Zero in on bad source data with automated segmentation analysis.
- Discover system failures with metadata monitoring and incident correlation.
- Surface bad queries and faulty logic with code change insights.
Prove it
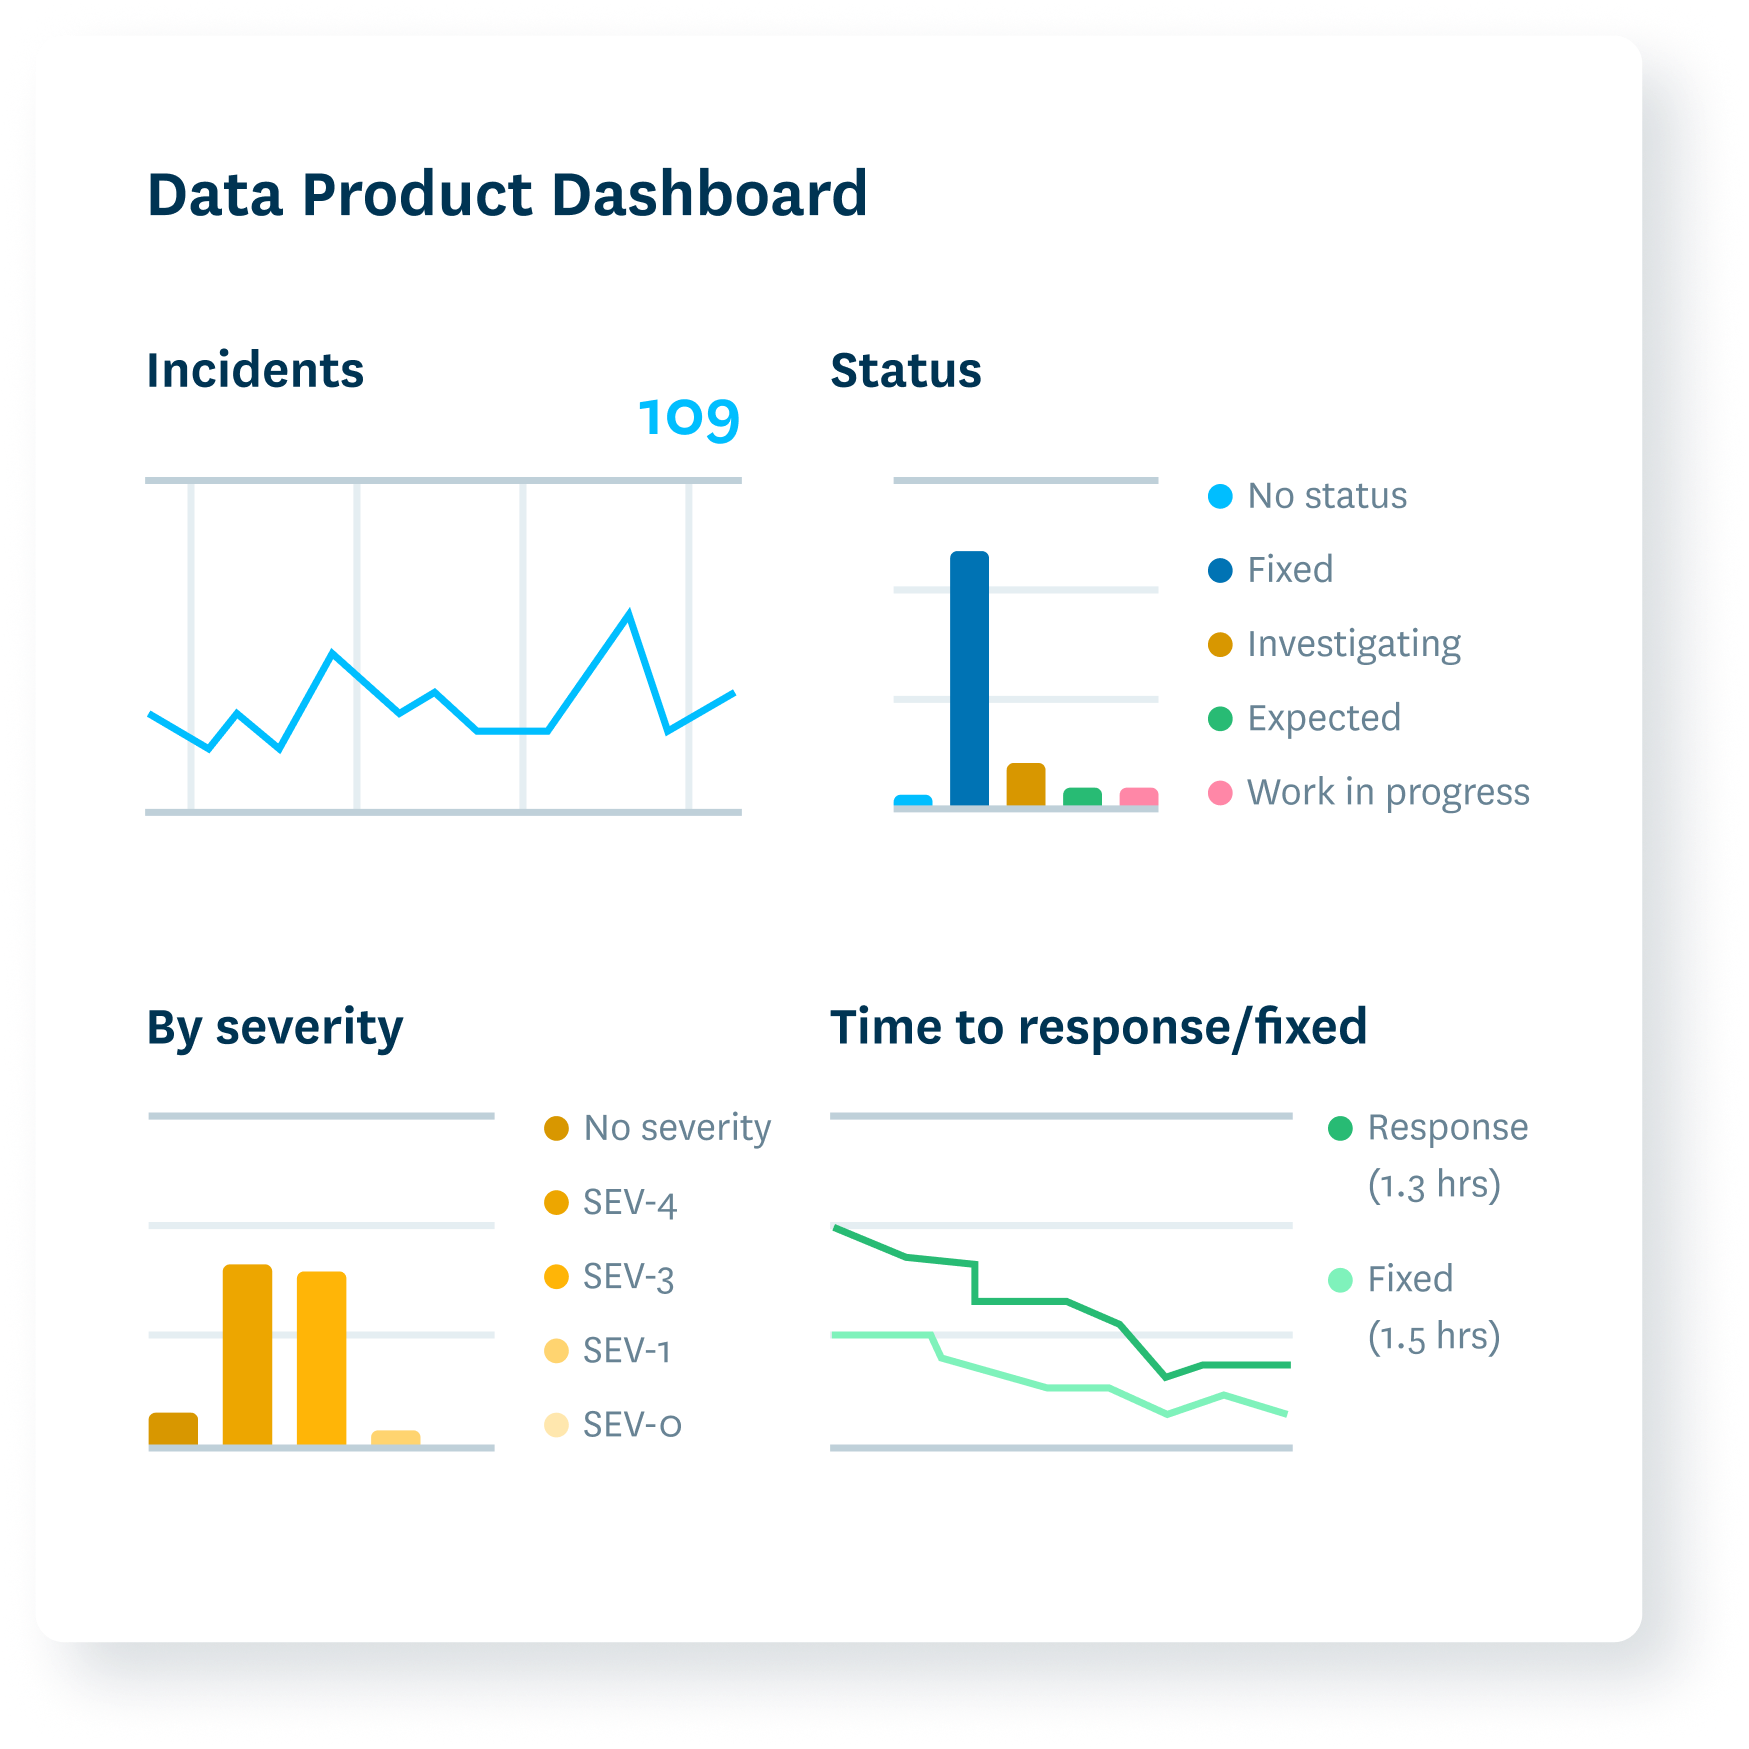
Build trust by displaying reliability levels and response times.
- Show how data reliability levels have changed.
- Communicate the current health of key assets.
- Measure your team’s operational response.
- Understand tables at a glance with AI data profiling.
Optimize it
Reduce cost and runtimes. Identify pipelines that have become inefficient over time.
- Get alerted to queries running longer than normal.
- Uphold performance SLAs.
- Filter queries related to specific DAGs, users, dbt models, warehouses, datasets and more.
- Validate your data’s “AI-readiness”
 Product demo.
  3 Steps to AI-Ready Data
  What is a data mesh--and how not to mesh it up
  The ULTIMATE Guide To Data Lineage