Product demo.
  3 Steps to AI-Ready Data
  What is a data mesh--and how not to mesh it up
  The ULTIMATE Guide To Data Lineage
 Rightsize Runtime
Don’t allow slow running pipelines to cost you time, money, and goodwill.


The Monte Carlo difference
Advanced filters and alerts.
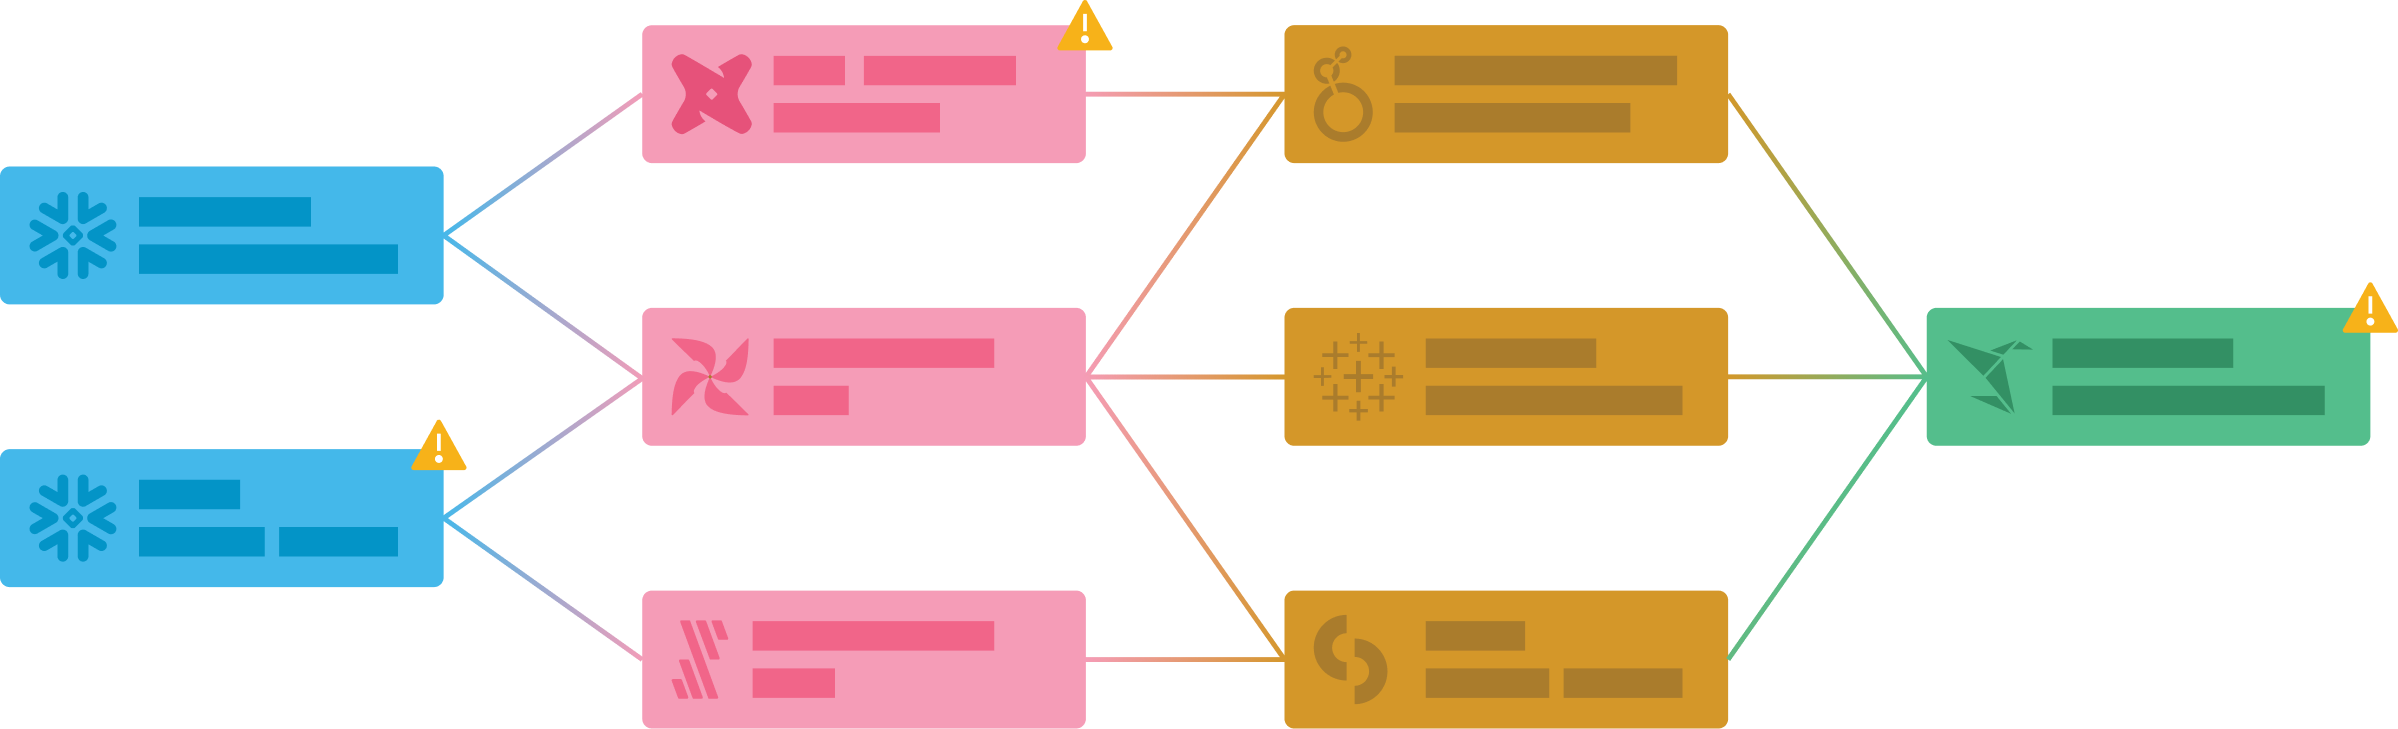
Pipeline performance to the business intellience level.
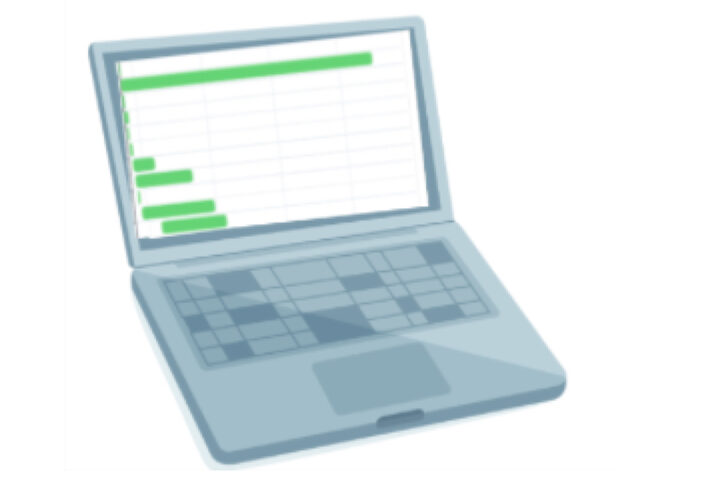
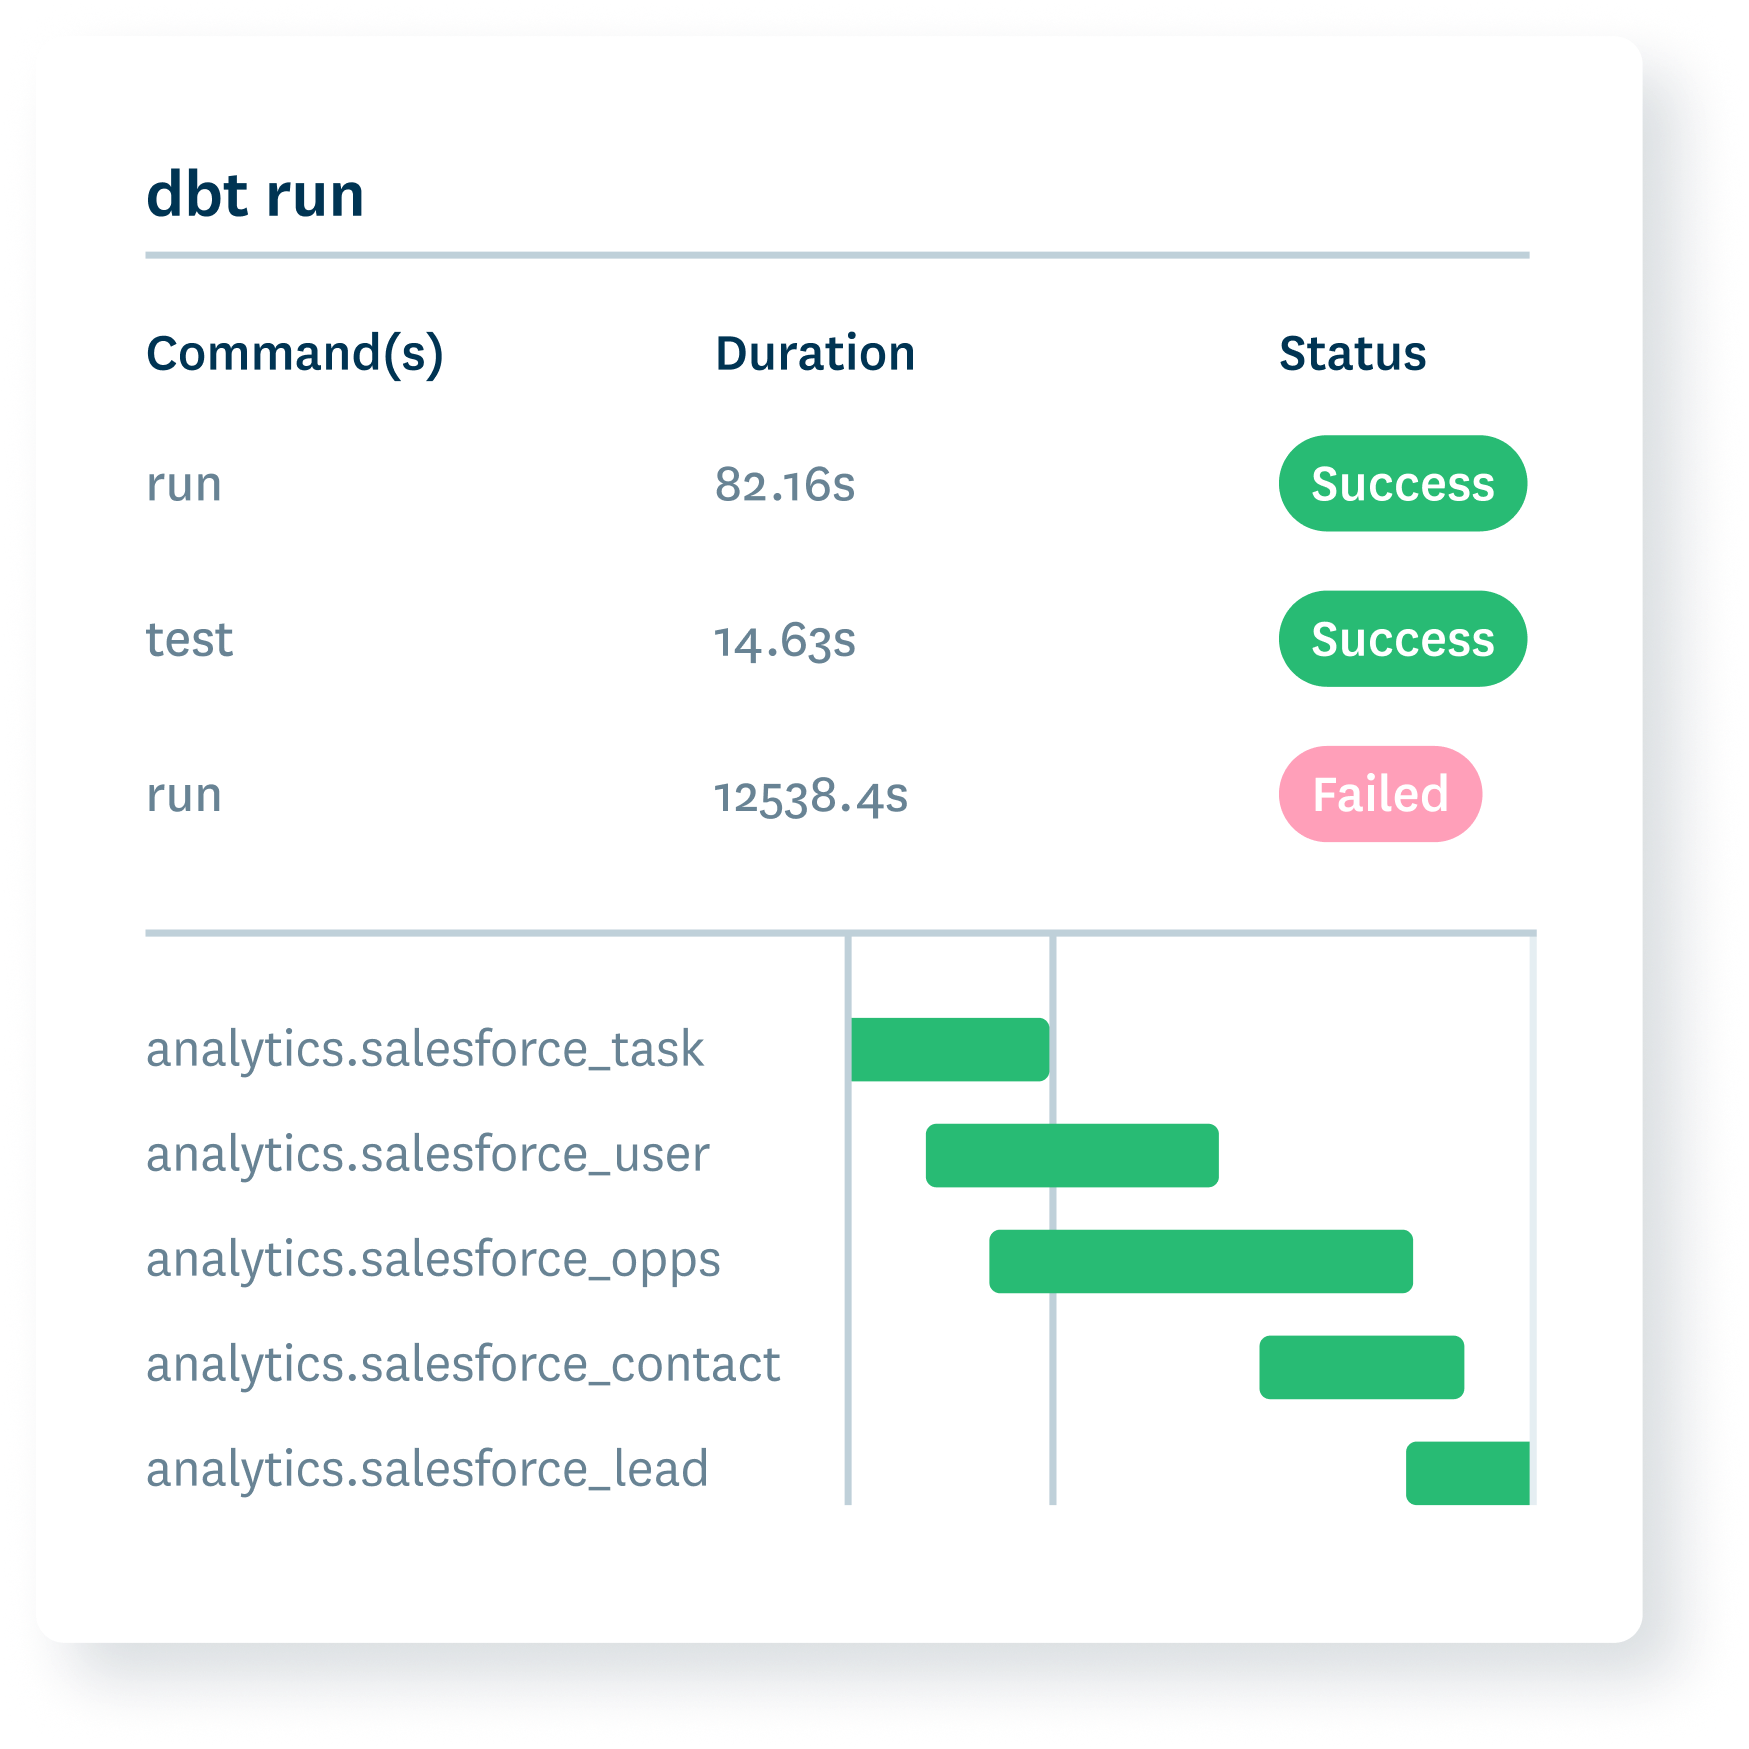
DAG Gantt charts to spot job bottlenecks.

“Through the implementation of [Monte Carlo] and other associated actions, the average throughput of data in the pipeline has reduced by 33% within the first 3 months.”
Tom Milner Director of Engineering
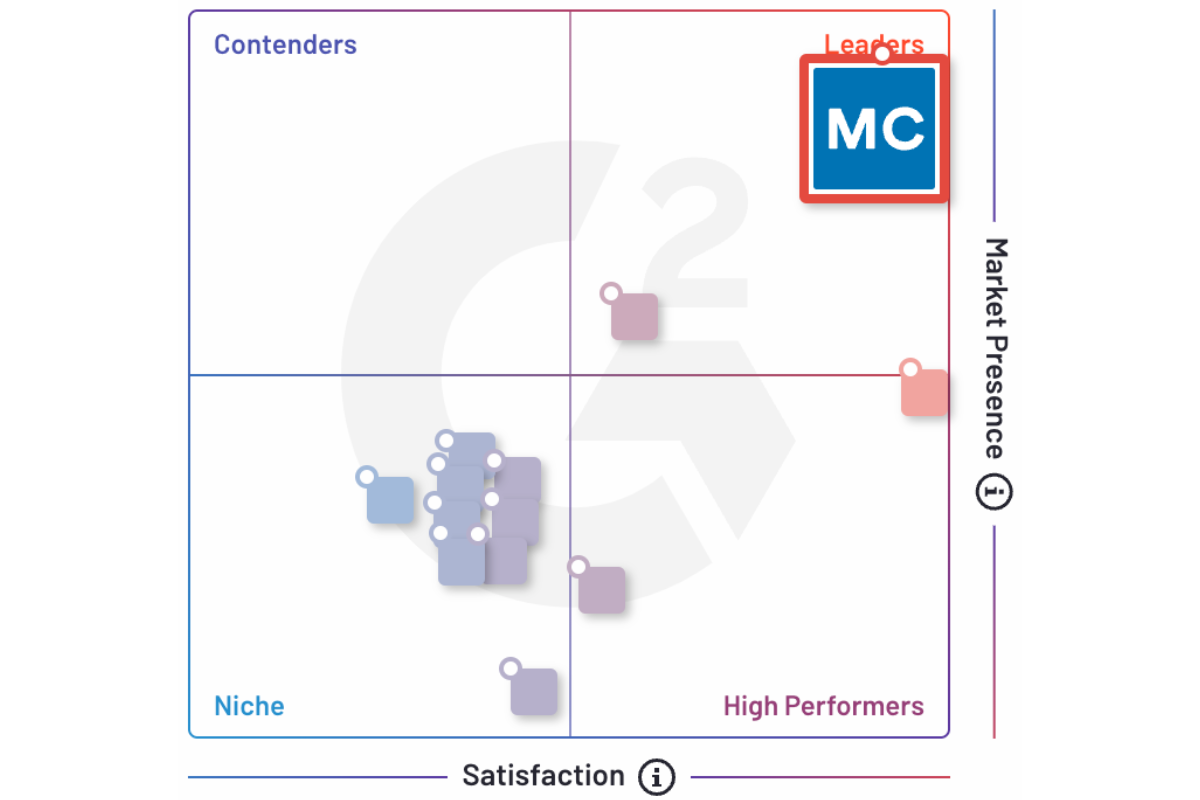
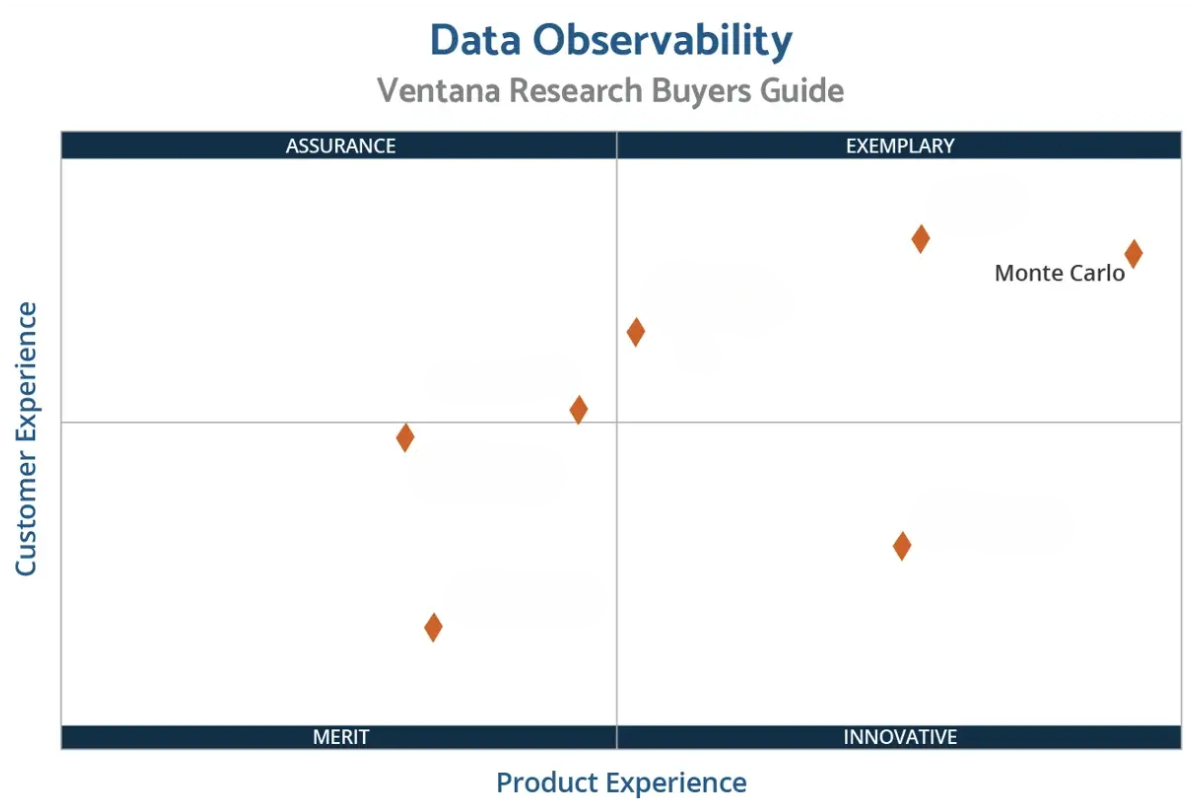
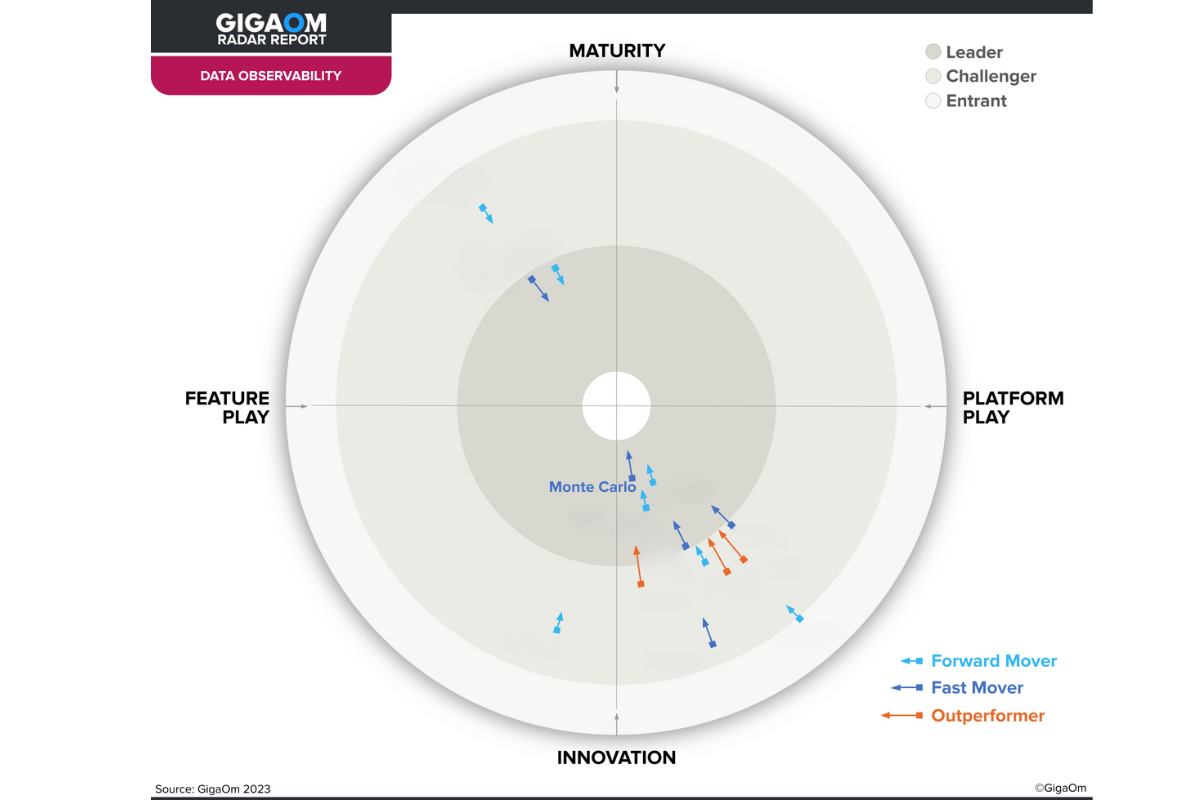
The Undisputed Leader
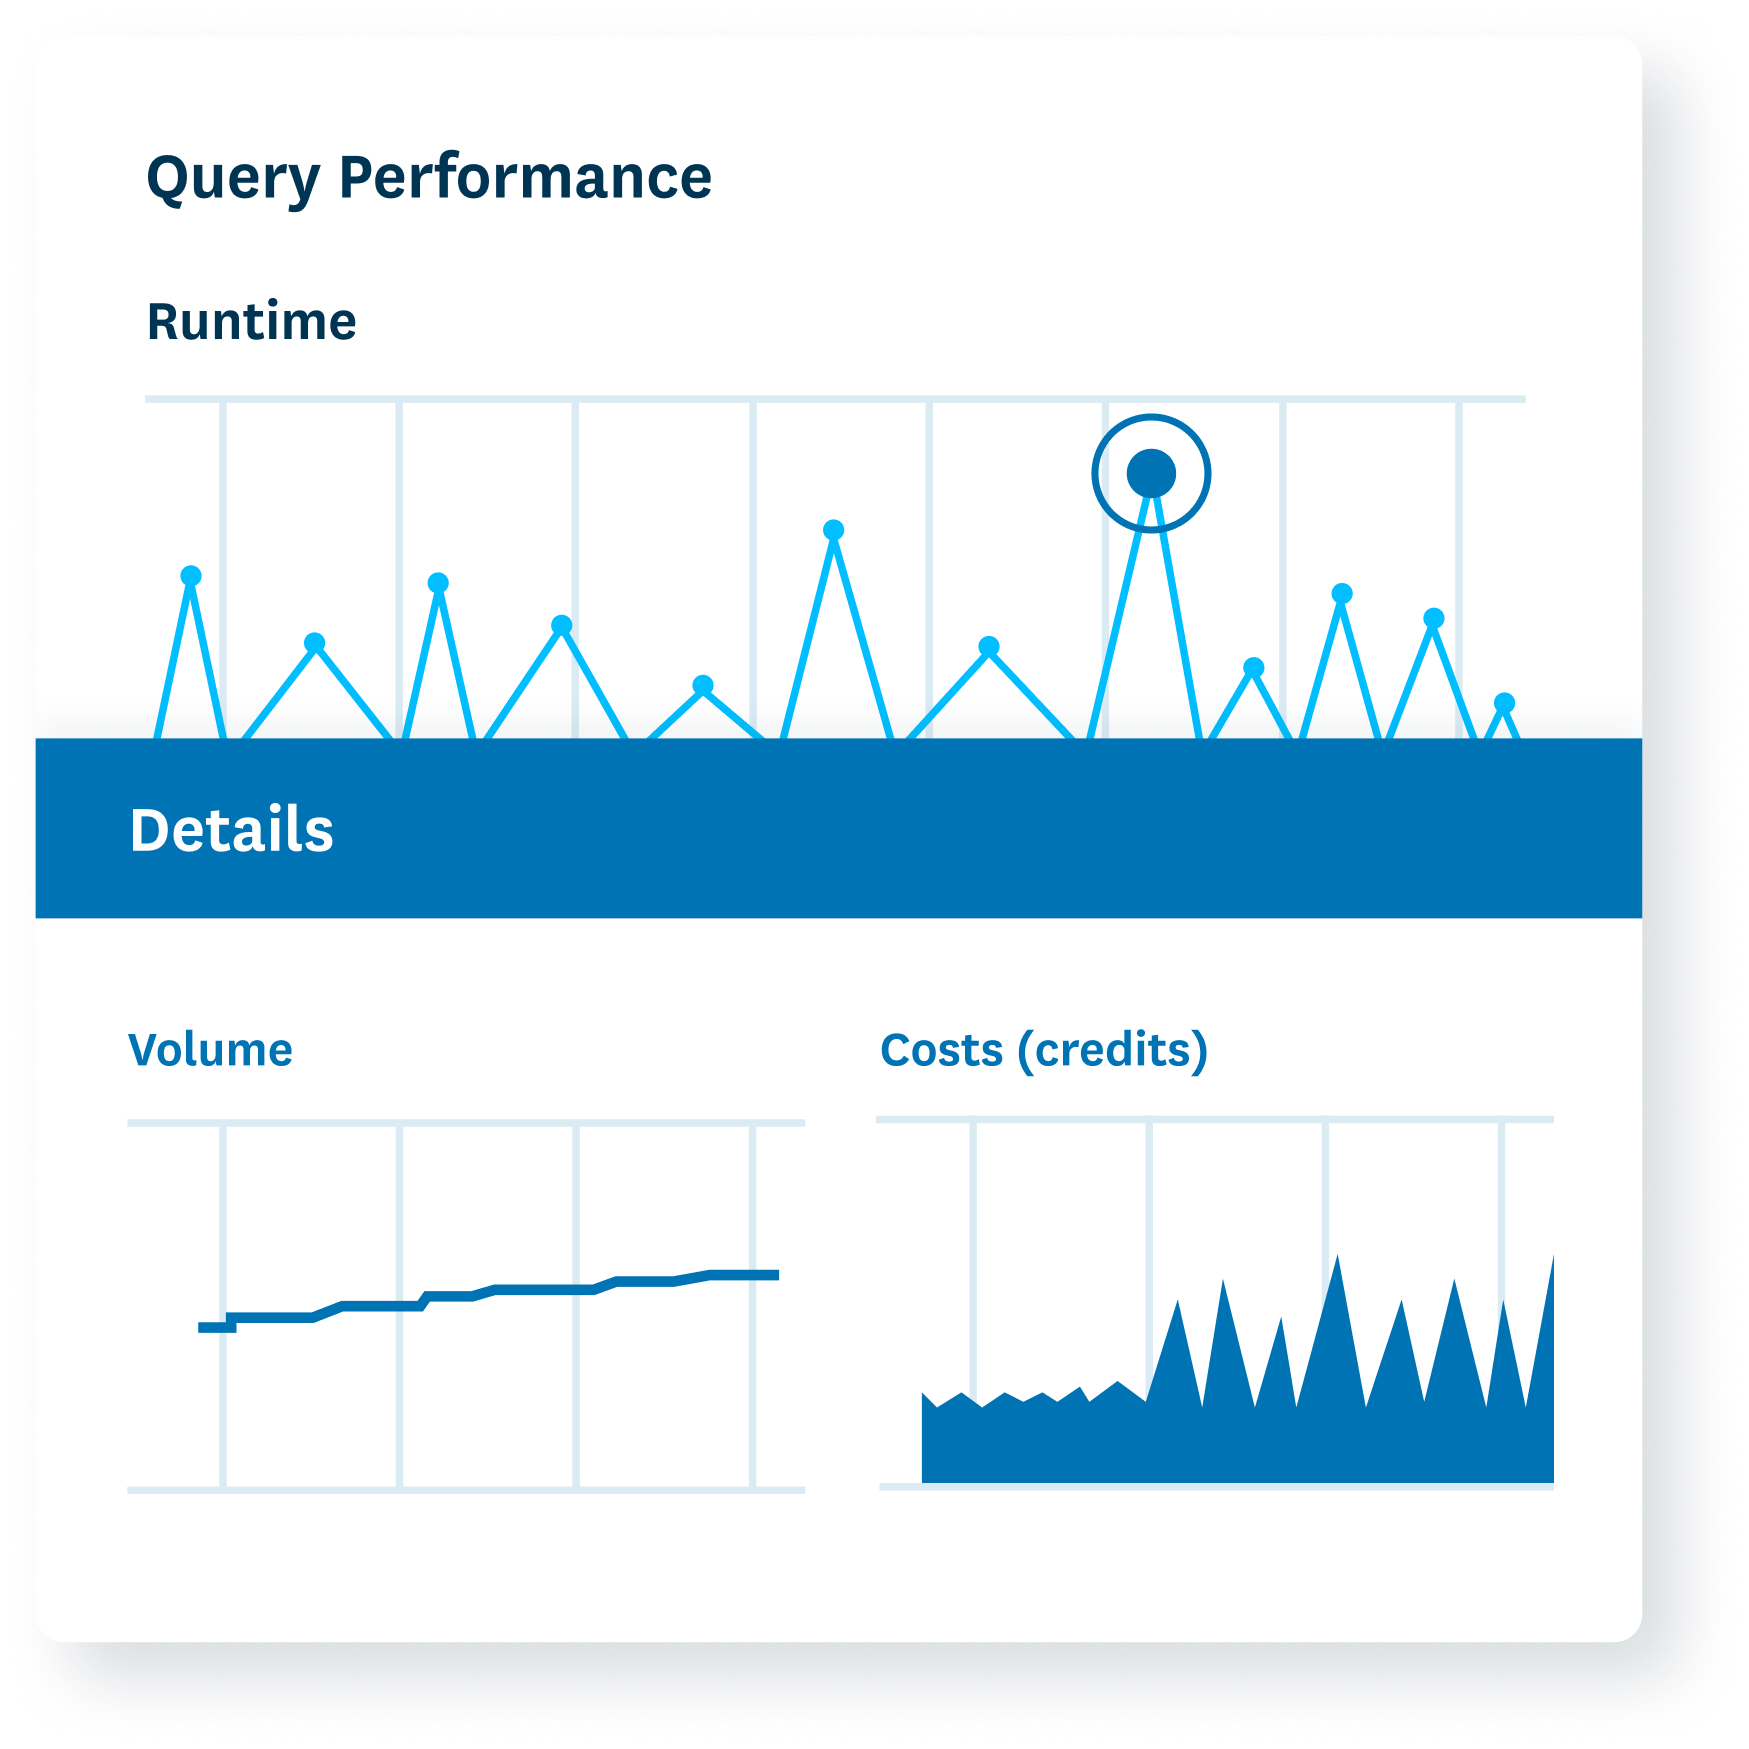
Investigate increasing costs
Keep costs in check.
- Get alerted to queries that are costing more credits or using more slots than normal.
- Drill in to see correlations with rows added, partitions/cache scanned, and more.
Remove pipeline bottlenecks
Find and optimize jobs that are creating long queue times.
- Explore multiple views to see which queries are creating bottlenecks in your Airflow or dbt DAGs.
Prevent slow dashboards
Avoid poor adoption and user complaints by ensuring dashboards load quickly.
- Set and uphold performance SLAs.
- Filter queries related to specific DAGs, users, dbt models, warehouses, datasets and more.